DEVSQ function - The function returns the sum of squares of deviations of data points from the sample mean in Excel
The following article introduces you to the DEVSQ function - one of the functions in the statistical function group is very popular in Excel.
Description: Returns the sum of squares of deviations of data points from the sample mean.
Syntax: DEVSQ (number1, [number2], .)
Inside:
- number1, number1: The value you want to sum the squares of their deviations, where number1 is the required value, from number1 onwards is optional and contains up to 255 number arguments .
Attention:
- The argument must be either a number or a reference array that contains numbers.
- If text or logical values are typed directly into the argument list -> it is still calculated in the function.
- If the reference form or array containing logical values and text will be ignored, the case of the value of 0 is still calculated.
- The function will give an error if the arguments are text or an error value cannot be converted into a number.
- The function using the equation to calculate the square of deviation is:
[DEVSQ = sum {{{left ({x - overline x} right)} ^ 2}}]
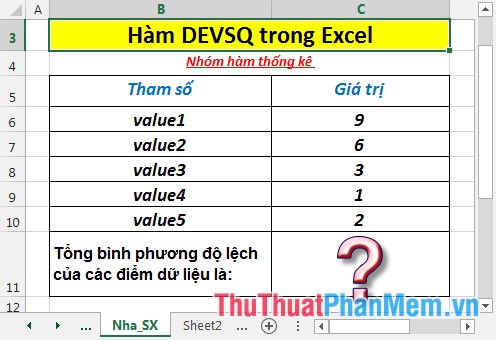
For example:
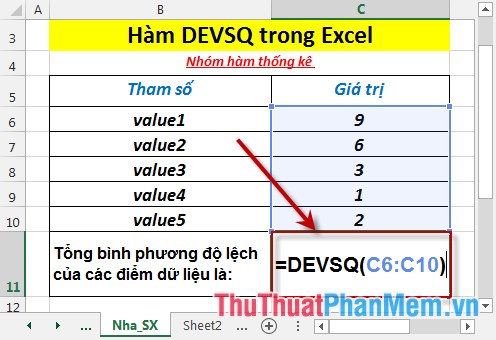
Calculate the sum of squares of deviations of data points in the table below:
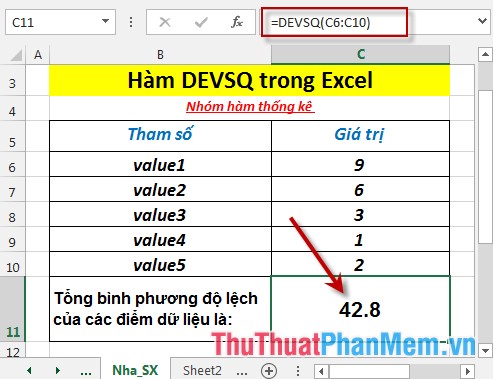
- In the cell to calculate enter the formula : = DEVSQ (C6: C10)
- Press Enter -> the sum of squares of deviations of data points is:
- Where the data points are non-adjacent cells. For example, calculate the sum of squares of deviations of data points in cells C6, C8, C10 -> enter the formula: = DEVSQ (C6, C8, C10)
Above are instructions and some specific examples when using DEVSQ function in Excel.
Good luck!
You should read it
- COVARIANCE.P function - The function returns the covariance of a set, the product of the average of degrees of instruction for each pair of data points in Excel
- STDEV function - The function of estimating standard deviations based on a sample in Excel
- ZTEST function - Returns the probability value on one side of the z test in Excel
- STDEV.S function - The function returns the standard deviation based on a sample in Excel
- SLOPE function - The function returns the slope of a linear regression line through data points in Excel
- STDEVA function - The function of estimating standard deviations based on a sample including both text and logical values in Excel
- AVEDEV function - The function returns the average absolute deviation of data points from their midpoint in Excel
- TTEST - Returns the probability associated with a Student's t-Test in Excel
May be interested
- BETA.DIST function - The function returns the Beta distribution in Excelbeta.dist function: the function returns the beta distribution to study the variability of a number of things through a sample. support functions from excel 2010 onwards. syntax: beta.dist (x, alpha, beta, cumulative, [a], [b])
- STDEVP function - The function of calculating standard deviations in Excelthe following article details how to use the stdevp function in excel, which helps you calculate standard deviations based on patterns.
- How to use the NORMDIST function in Excel - Function that returns the distribution in Excelthe normdist function returns a distribution with a specified mean and standard deviation. the normdist function has applications in statistics, including hypothesis testing.
- TRIMMEAN function - The function returns the average of the inner part of a dataset in Exceltrimmean function: the function returns the average of the inside of the data set. the function calculates by removing which percentage of the value is in the first or last boundary of the data set. syntax: trimmean (array, percent)
- QUARTILE.EXC function - The function returns the quartile of a dataset without values 0 and 1 in Excelquartile.exc function: the function returns the quartile of the data set, with percentile values from 0 to 1 excluding 0 and 1. the support function is from excel 2010 onwards. syntax: quartile.exc (array, quart)
- LINEST function - The function returns a line description array using the least square method in Excellinest function: the function returns the line description array using the least squares method. syntax: linest (known_ys, [known_xs], [const], [stats])
- F.DIST.RT function - The function returns the right probability distribution F for 2 data sets in Excelf.dist.rt function: the function returns the right probability distribution f for 2 data sets. support functions from the excel 2010 version. syntax: f.dist (x, deg_freedom1, deg_freedom2)
- SKEW function - The function returns the deviation of the distribution in Excelskew function: the function returns the deviation of the distribution - the deviation represents the asymmetry of the distribution around its axis. - negative deviations: the distribution with the asymmetric side extends more to the negative value. - positive deviation: the distribution with the asymmetric side extends much to g
- FTEST function - The function returns the result of an F-Test in Excelthe following article details how to use ftest - the function returns the result of an f-test. in statistical probability, the determination of the correctness and the deviation between two data samples is a regular and extremely important job.
- HARMEAN function - The function returns the harmonic average of a data set in Excelharmean function: the function returns the harmonic mean of a dataset, the harmonic mean is the reciprocal of the arithmetic mean of the reciprocals. syntax: harmean (number1, [number2], ...)