F.DIST.RT function - The function returns the right probability distribution F for 2 data sets in Excel
The following article introduces you to the F.DIST.RT function - one of the functions in the statistical function group is very popular in Excel.
Description: The function returns the right probability distribution F for 2 data sets. Support function from Excel 2010 version.
Syntax: F.DIST (x, deg_freedom1, deg_freedom2)
Inside:
- x: The value of the function, is a required parameter.
- deg_freedom1: The degree of freedom in the numerator, is a required parameter.
- deg_freedom2: The degrees of freedom in the denominator, are required parameters.
Attention:
- If any parameters are not numeric -> the function returns the #VALUE! Error value .
- If x <0 -> the function returns the #NUM! Error value
- If deg_freedom1 , deg_freedom2 are not whole numbers -> they are truncated to integers.
- If deg_freedom1 <1 or deg_freedom2 <1 -> the function returns the #NUM! Error value
- The F.DIST.RT function is calculated as F.DIST.RT = P (F> x) where F is a random variable.
For example:
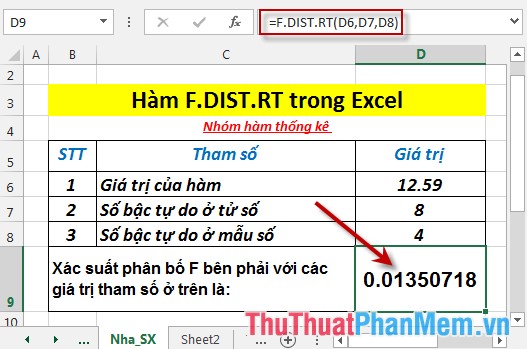
Calculate the right probability distribution F according to the data in the following data table:
- In the cell to calculate enter the formula : = F.DIST.RT (D6, D7, D8)
- Press Enter -> probability of distribution F is:
- Where the function value is less than 0 -> the function returns the #NUM! Error value
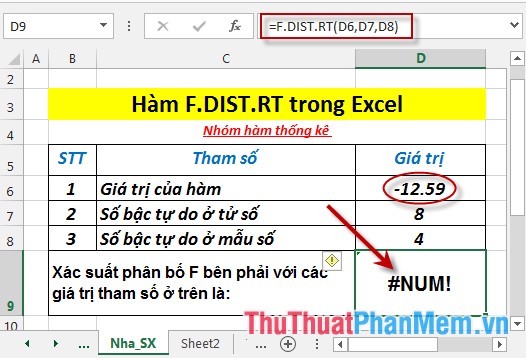
- If the number of degrees of freedom in the numerator and sample is less than 1 -> the function returns the #NUM! Error value
Above are instructions and some specific examples when using F.DIST.RT function in Excel.
Good luck!
You should read it
- T.DIST.RT - The function returns the Student's t-distribution on the right in Excel
- HYPGEOM.DIST - The function returns the hyperbolic distribution in Excel
- CHISQ.DIST.RT function - The function returns the right end probability of the distribution when squared in Excel
- T.DIST - The function returns the Student t-distribution on the left in Excel
- T.DIST.2T - The function returns the two-tailed Student distribution in Excel
- BINOM.DIST.RANGE function - The function returns the probability of a test result using binomial distribution in Excel
- NEGBINOM.DIST function - Function returns the negative binomial distribution in Excel
- POISSON.DIST function - The function returns the Poisson distribution in Excel
May be interested
- F.INV function - The function returns the inverse of the probability distribution F in Excelf.inv function: the function returns the inverse of the probability distribution f. support function from the excel 2010 version. syntax: f.inv (probability, deg_freedom1, deg_freedom2)
- F.INV.RT function - The function returns the right-inverse head value of the probability distribution F in Excelf.inv.rt function: the function returns the inverse of the right probability distribution f. support functions from the excel 2010 version. syntax: f.inv.rt (probability, deg_freedom1, deg_freedom2)
- F.TEST function - The function returns the result of the F - test in Excelf.test: the function returns the result of the f - test, the probability of two ends where the variance of 2 arrays is not significant. support functions from excel 2010 version. syntax: f.test (array1, array2)
- FISHER function - The function returns the Fissher transformation at x in Excelfisher function: the function returns the fissher transformation at x. this transformation creates a normal distribution function, using this function to test a hypothesis based on a correlation coefficient. syntax: fisher (x)
- FISHERINV function - Function that returns the inverse of the Fissher transformation in Excelfisherinv function: the function returns the inverse of the fissher transformation. use this function to analyze the correlation between two data arrays, if y = fisher (x) -> fisherinv (y) = x. syntax: fisher (y)
- FORECAST function - The function returns a value along a linear trend in Excelforecast function: the function performs the calculation or prediction of a future value by using current values using linear regression. in excel 2016 this function is replaced by forecast.linear function. syntax: forecast (x, known_ys, known_xs)