SLN function - Returns the depreciation value of an asset using the straight-line method in Excel
The following article details the syntax and usage of SLN in excel. Description: Returns the depreciation of assets according to the straight-line method over a given period.
The following article details the syntax and usage of SLN in excel.
Description: Returns the depreciation of assets according to the straight-line method over a given period.
Syntax: SLN (cost, salvage, life) .
Inside:
- cost : The initial cost of the property, is a required parameter.
- salvage : Value after depreciation, also called the value of product recall, is a mandatory parameter.
- life : Number of periods of depreciation, also known as useful life of assets, is a required parameter.
Attention:
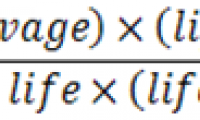
- SLN function is calculated by the formula:

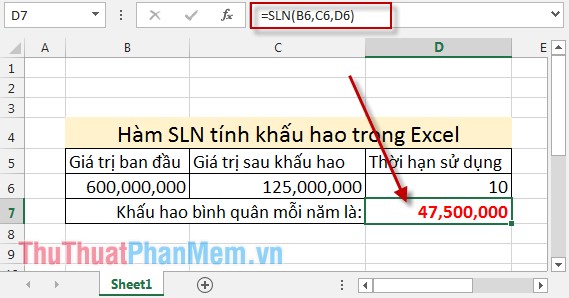
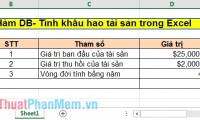
For example: Calculating the annual average depreciation for an asset with initial value of 600,000,000 and the remaining value after depreciation is 125,000,000 and the asset has a shelf life of 10 years.

In the cell to calculate enter the formula: = SLN (B7, C7, D7) .

Press Enter -> the average depreciation per year of the property over a 10 year period is:
The above is a detailed guide of usage and specific example of SLN function. Hope to help you in the case of depreciation calculation.
Good luck!
Was this article helpful?
Your feedback helps us improve.
Related Articles
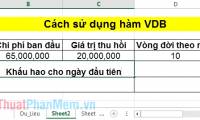 VDB function - Calculate asset depreciation by the declining balance method in Excel4 minutes read
 SYD function - Calculate depreciation for an asset by remaining value in Excel2 minutes read
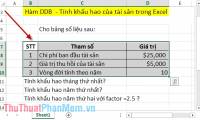 DDB function - Calculate depreciation of assets in Excel3 minutes read
 AMORDEGRC function - The function returns the depreciation for each accounting period in Excel4 minutes read
 LINEST function - The function returns a line description array using the least square method in Excel4 minutes read
 DB function - The function calculates the depreciation of assets with specific maturity in Excel3 minutes read
Reader Comments 0
Sign in with email or Google to join the discussion.