LINEST function - The function returns a line description array using the least square method in Excel
LINEST function: The function returns the line description array using the least squares method. Syntax: LINEST (known_ys, [known_xs], [const], [stats])
The following article introduces you to the LINEST function - one of the functions in the statistical function group is very popular in Excel.

Description: The function returns the line description array using the least squares method.
Syntax: LINEST (known_y's, [known_x's], [const], [stats])
Inside:
- known_y's : The set of known y values in the relationship y = b * m ^ x, is a required parameter.
+ If known_y's is in a single column or row -> each known_y's column or row is interpreted as a separate variable.
- known_x's: The set of known x values in the relationship y = b * m ^ x, is an optional parameter.
+ known_x's may include 1 or more sets of variables.
+ If known_x's is omitted -> it is assumed to be an array of the same size as known_y's
- const: The logical value determining the value of the constant b, is an optional value including the following values:
+ const = True or ignore -> b is calculated normally.
+ const = False or ignore -> b = 1 and m are adjusted such that: y = m ^ x.
- stats: Logical values that determine the type of additional regression statistics returned include: {mn, mn-1, ., m1, b; sen, sen-1, ., se1, seb ; r2, sey; F, df; ssreg, ssresid}.
Attention:
- Can describe any straight line by slope and intersection y:
+ Slope (m):
To find the slope of line m, take two points on that line, (x1, y1) and (x2, y2) -> slope equal to (y2 - y1) / (x2 - x1).
+ Intersection Y (b):
The intersection y of a line b, is the value of y at the point where the line intersects the y-axis.
The equation of the line is y = mx + b . You can calculate any point on a straight line by entering the value y or x into the equation.
- When there is only one independent variable -> use the formula:
+ Slope:
= INDEX (LINEST (known_y's, known_x's), 1)
+ Crossing Y:
= INDEX (LINEST (known_y's, known_x's), 2)
+ Use commas to separate values in the same row.
+ Use semicolons separating between rows together.
- When there are some independent variables x -> use the formula:
[m = frac {{sum {left ({x - overline x} right) left ({y - overline y} right)}}} {{sum {{{left ({x - overline x} right)} ^ 2 }}}}]
[b = overline y - moverline x]
Where: x = AVERAGE (known x's ) and y = AVERAGE (known_y's).
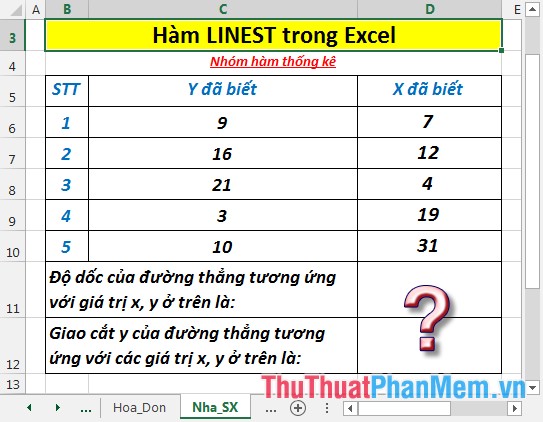
For example:
Calculate the slope and y intersection of the line corresponding to the values of x and y in the data table below:
- Calculate the slope m of the line corresponding to the values of x and y. In a cell to calculate enter the formula : = LINEST (C6: C10, D6: D10, FALSE)
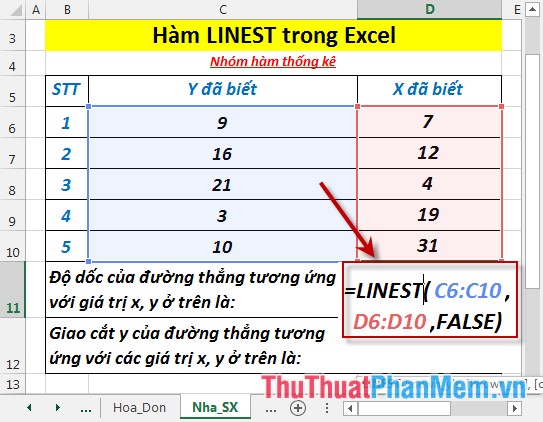
- Press Enter -> slope m of the line corresponding to the values of x and y are:

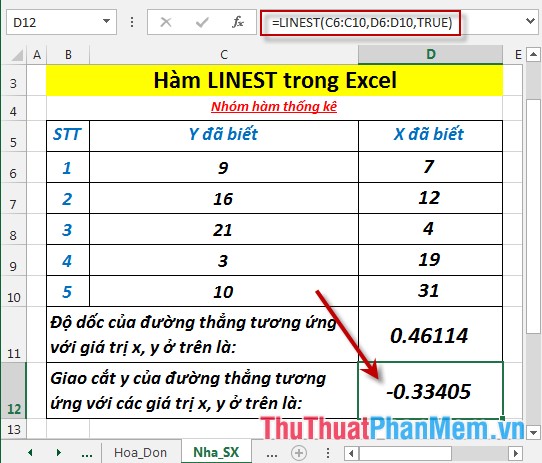
- Calculate the intersection y of the line corresponding to the values of x and y. In the cell to calculate enter the formula : = LINEST (C6: C10, D6: D 10, TRUE)

- Press Enter -> y intersection of the line corresponding to the values x, y are:
Above are instructions and some specific examples when using the LINEST function in Excel.
Good luck!
Was this article helpful?
Your feedback helps us improve.
Related Articles
 SLN function - Returns the depreciation value of an asset using the straight-line method in Excel2 minutes read
 MODE.MULT function - The function returns a vertical array of the most common values in Excel3 minutes read
 TTEST - Returns the probability associated with a Student's t-Test in Excel3 minutes read
 GEOMEAN function - The function returns the average of a positive array or range of data in Excel2 minutes read
 How to use the Match function in Excel5 minutes read
 The SQRT function returns the square root of a positive number in Excel2 minutes read
Reader Comments 0
Sign in with email or Google to join the discussion.