FORECAST function - The function returns a value along a linear trend in Excel
FORECAST function: The function performs the calculation or prediction of a future value by using current values using linear regression. In Excel 2016 this function is replaced by FORECAST.LINEAR function. Syntax: FORECAST (x, known_ys, known_xs)
The following article introduces you to the FORECAST function - one of the functions in the statistical function group is very popular in Excel.

Description: The function performs a calculation or prediction of a future value by using current values using linear regression. In Excel 2016 this function is replaced by FORECAST.LINEAR function .
Syntax: FORECAST (x, known_y's, known_x's)
Inside:
- x: Data point to predict a value for it, is a required parameter.
- known_y's: Dependent array of an array or range of data.
- known_x's: Independent array of array or range of data .
Attention:
- If x is not a number -> the function returns the #VALUE! Error value .
- If known_y's or known_x's are empty or contain a different number of data points -> the function returns the # N / A error value
- If known_x's = 0 -> variance, the function returns the DIV / 0 error value !
- FORECAST transform equation is: A + BX where:
(a = bar y - bbar x)
(b = frac {{sum {(x - bar x) (y - bar y)}}}} {{sum {{{(x - bar x)} ^ 2}}}})
And x, y are the average samples of AVERAGE (known_x's) and AVERAGE (known y's).
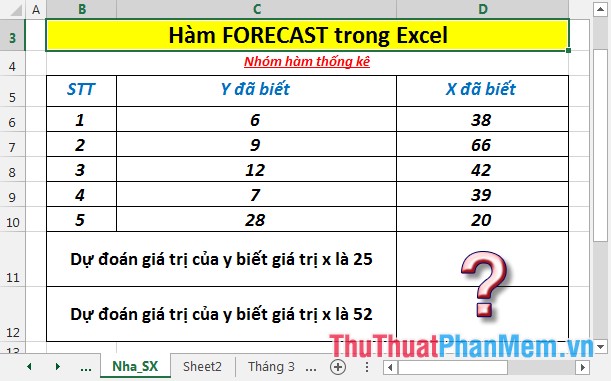
For example:
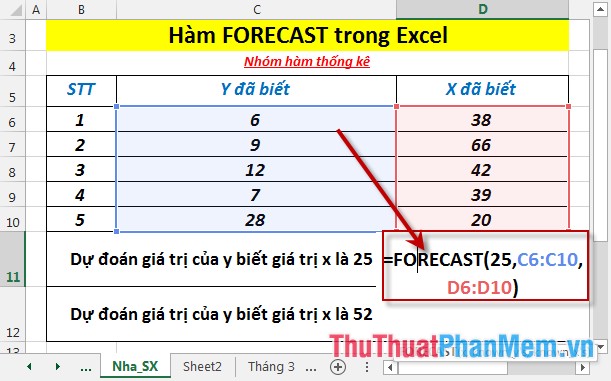
Find the predicted value of y and the x value is 25 and 52, respectively:
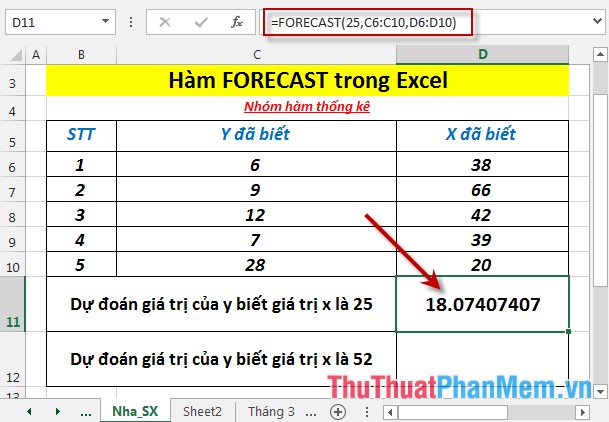
- Predict the value of y to know the value of x is 25. In the cell to calculate enter the formula : = FORECAST (25, C6: C10, D6: D10)
- Press Enter -> Predict the value of y is:
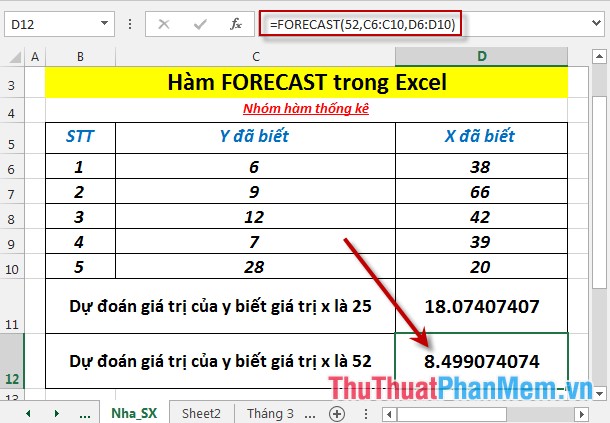
- Similarly, copy for the case that the value of x is 52 results in:
- Where the number of data points of the two different x and y arrays is different -> the function returns the # N / A error value
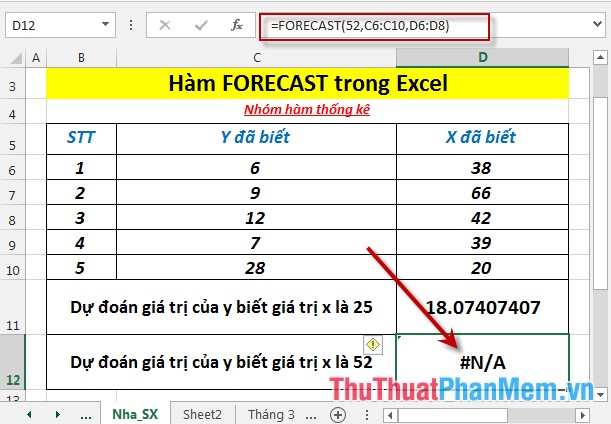
Here the value array of x is known only from C6 -> C8 (there are 3 data points) while that of y from C6 -> C10 (there are 5 data points).
Above are instructions and some specific examples when using FORECAST function in Excel.
Good luck!
Was this article helpful?
Your feedback helps us improve.
Related Articles
 TREND - The function returns values in a linear trend in Excel3 minutes read
 SLOPE function - The function returns the slope of a linear regression line through data points in Excel3 minutes read
 WEIBULL function - The function returns the Weibull distribution in Excel3 minutes read
 How to use TREND - FORECAST function5 minutes read
 PEARSON function - The function returns the Pearson product moment correlation coefficient in Excel3 minutes read
 How to use the NORMDIST function in Excel - Function that returns the distribution in Excel3 minutes read
Reader Comments 0
Sign in with email or Google to join the discussion.