PEARSON function - The function returns the Pearson product moment correlation coefficient in Excel
The following article introduces you to the PEARSON function - one of the functions in the statistical function group is very popular in Excel.
Description: The function returns the Pearson product moment correlation coefficient, r with a scalar index in the range of -1 to 1. The function reflects the linear relationship expansion between the two data sets.
Syntax: PEARSON (array1, array2)
Inside:
- array1: Independent value set, required parameter .
- array2: Set of dependent values, required parameters .
Attention:
- The value of the argument must be a number, name or reference array containing numbers.
- If the argument is a reference or an array containing logical values or text -> these values are ignored, but the value 0 is still counted.
- If array1, array2 contains different data points -> the function returns the # N / A error value .
- The formula for Pearson product moment correlation coefficient, r is:
[r = frac {{sum {left ({x - overline x} right) left ({y - overline y} right)}}} {{sqrt {sum {{{left ({x - overline x} right)} ^ 2} sum {{{left ({y - overline y} right)} ^ 2}}}}}}]
Inside:
x and y are the samples AVERAGE (array1) and AVERAGE (array2)
For example:
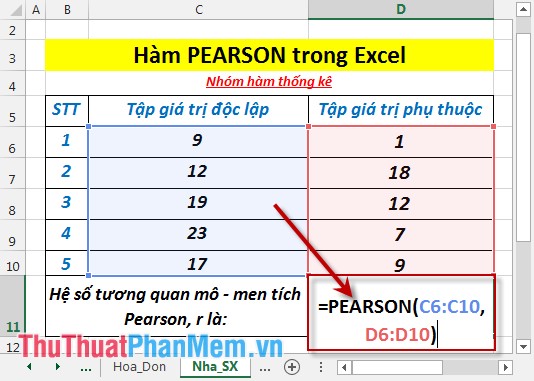
Find the Pearson product moment correlation coefficient, r of the two data sets in the data table below:
- In the cell to calculate enter the formula : = PEARSON (C6: C10, D6: D10)
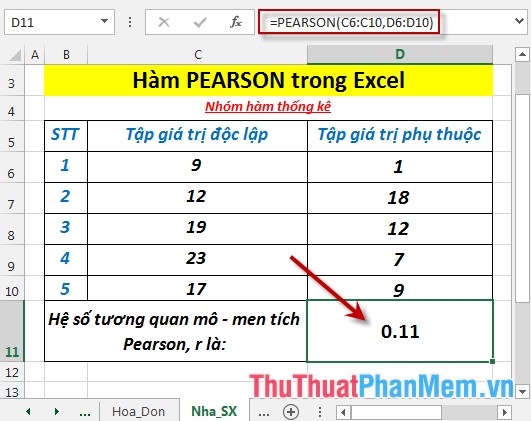
- Press Enter -> Pearson product moment correlation coefficient, r of 2 data sets is:
- In case the number of data points of 2 different data sets, for example, here the independent value set has 5 elements but the dependent value set has only 3 elements -> the function returns the # N / error value A.
Above are instructions and some specific examples when using PEARSON function in Excel.
Good luck!
You should read it
- FISHER function - The function returns the Fissher transformation at x in Excel
- KURT function - The function returns the sharp coefficient of a dataset in Excel
- How to use the kernel function (PRODUCT function) in Excel
- RANK.AVG function - The function returns the rank of a number in a list of numbers in Excel
- FISHERINV function - Function that returns the inverse of the Fissher transformation in Excel
- RANK.EQ function - Function returns the rank of a number in a list of numbers, returns the highest rank when multiple values with the same rank in Excel
- How to use the IF function in Excel
- How to use the IFS function in Excel 2016
May be interested
- PERCENTILE.EXC function - The function returns the kth percentile of values in the range, with k in the range from 0 to 1 in Excelpercentile.exc function: the function returns the kth percentile of values in the range with k in the range from 0 to 1, excluding values 0 and 1. syntax: percentile.exc (array, k)
- PERCENTILE.INC function - Function returns the kth percentile of values in the range with k in the range from 0 to 1 in Excelpercentile.inc function: the function returns the kth percentile of values in the range with k in the range from 0 to 1. syntax: percentile.inc (array, k)
- PERMUT function - The function returns the number of permutations of a given number of objects in Excelpermut function: the function returns the number of permutations of a given object. permutations are subsets of values where the position and number of elements in permutations are different. syntax: permut (number, number_chosen)
- PERMUTATIONA function - The function returns the number of permutations (can be repeated) of a given object in Excelpermutationa function: the function returns the number of permutations (can be repeated) of a given object. support functions from excel 2013 onwards. syntax: permutationa (number, number_chosen)
- PHI function - The function returns the value of the density function for a normal distribution in Excelphi function: the function returns the value of the density function for a standard normal distribution. support functions from excel 2013 onwards. syntax: phi (x)
- POISSON.DIST function - The function returns the Poisson distribution in Excelpoisson.dist function: the function returns the poisson distribution, the application function to predict the number of events in a specific time. support functions from excel 2013 onwards. syntax: poisson.dist (x, mean, cumulative)