How to create a battery usage chart on Windows 10
Windows 10 supports a small but quite useful feature that helps you know the status of your laptop battery continuously over time, which is to create a battery usage graph.
Although traditional desktops are still an important part of the Windows ecosystem, users are tending to switch to high-mobility devices for flexible usability, while still ensure enough performance, even redundant in many situations. On such devices, the battery is one of the especially important factors, sometimes even more than the performance of the system. A laptop will not be able to carry the true meaning of a laptop if the battery is too weak.
Effective battery management is also important. If you do this well, the battery will last longer, which can serve you longer. Windows 10 supports a small but quite useful feature that helps you know the status of your laptop battery continuously over time, which is to create a battery usage graph.
Basically, the battery usage chart allows you to capture continuous information about the state of the battery and thereby adjust usage accordingly. However this chart will not be available that you must activate by command.
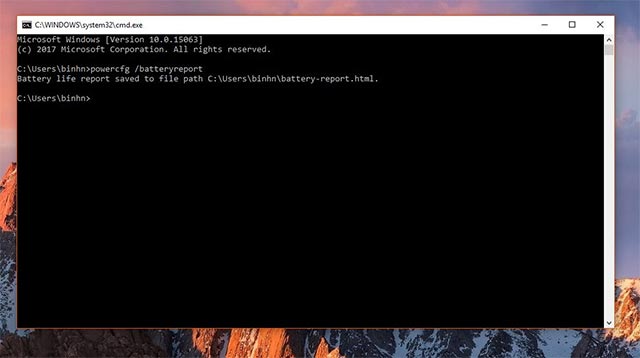
First, you need to log into your Windows 10 device with an administrator account (admin) launch cmd.exe with administrator rights (via the Start menu) and then enter the following command:
powercfg sprIt will take a few seconds for Windows to execute the command, but do not rush to close the cmd window as the whole process can take up to a minute in some specific cases. And then create reports using HTML format that you can launch in any browser. As soon as the command is successfully executed, the system will generate an HTML format report that you can open in any web browser tool.
 HTML file path
This HTML file, called System Power Report, is not automatically launched, but your command line utility will only display the link to it (usually: ' Battery life report saved to C: Userbattery-report.html ' ). In other words, you need to perform the entire process manually, which is to copy the path of the HTML file and open it in the web browser.
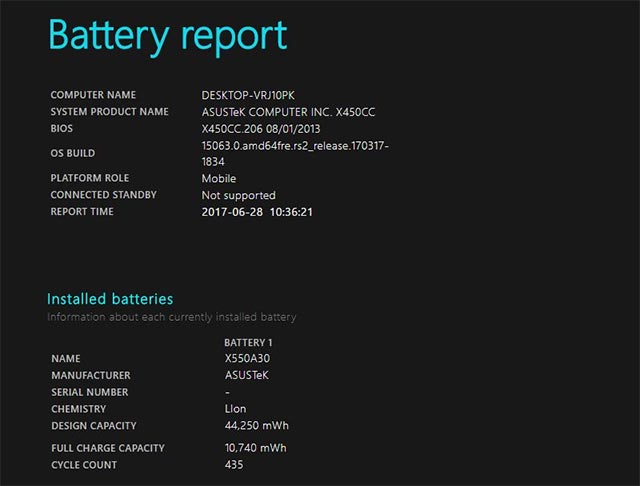
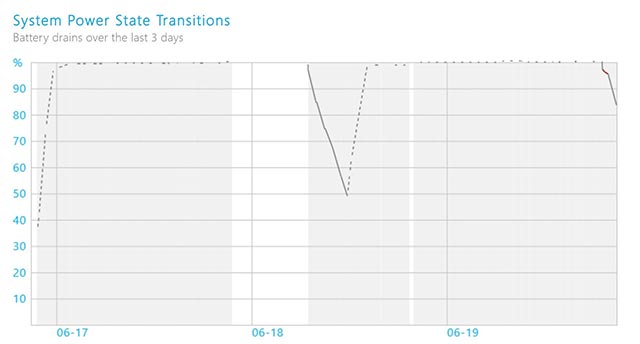
The System Power Report contains a set of essential information regarding the state of the battery on your laptop, including the usage graph shown quite visually.
This is a useful feature, but still relatively 'sketchy'. Hopefully in the new updates, Microsoft will make it a default feature that can be easily activated and used on Windows 10.
- Instructions for inserting, drawing and creating charts in Word 2007
- How to create a bar chart in Excel
- 8 types of Excel charts and when you should use them
- How to create a spreadsheet chart in Canva Sheets
- How to create a grid chart on MathType
- How to create a pie chart in Microsoft Excel
- How to Create a Multi-Line Chart in Excel
- How to create a pie chart in Excel
- Ranking the best laptops in early 2025
- How to check battery capacity and wear - check laptop battery
- No need to install any software, this is how to check your laptop battery level
- Compare battery life of Macbook Air 2013 and Ultrabooks running Windows 8
- Small brand laptop: Difficult to find a place
- 13 'champions' in the laptop world
- Full package of accessories for netbooks
- Stylish with ultra-thin laptops
- Laptop styling is more important than features
- Netbooks are increasingly 'close to' laptops


-
 Why does my phone's battery drain even when I'm not using it?
-
How to accurately check the battery health of Windows and MacBook laptops.
-
How many mAh is one battery cell? Calculation method and detailed example.
-
Check Samsung battery health, check the battery degradation of your Samsung phone.
-
2 ways to display battery percentage on Android 10 phones
-
How to fix an iPhone that keeps shutting down.
 Why does my phone's battery drain even when I'm not using it?
 How to accurately check the battery health of Windows and MacBook laptops.
 How many mAh is one battery cell? Calculation method and detailed example.
 Check Samsung battery health, check the battery degradation of your Samsung phone.
 2 ways to display battery percentage on Android 10 phones
 How to fix an iPhone that keeps shutting down.