CORREL function - The function returns the correlation coefficient between two data sets in Excel
CORREL function: The function returns the correlation coefficient between two data sets. Correlation coefficient is used to determine the relationship between two attributes. Syntax: CORREL (array1, array2)
The following article introduces you to the CORREL function - one of the functions in the statistical function group is very popular in Excel.

Description: The function returns the correlation coefficient between two data sets. Correlation coefficient is used to determine the relationship between two attributes.
Syntax: CORREL (array1, array2)
Inside:
- array1: The range of cells containing the values of the first dataset .
- array2: The range of cells containing the values of the second dataset .
Attention:
- If data cells or references contain logical values, text or blank cells -> they are ignored.
- If array1 and array2 have different data points -> the function returns the # N / A error value .
- If array1 and array2 are empty or the standard deviation of the values of 2 data sets is 0 -> the function returns the # DIV / 0 error value !
- The function equation used is:
[C {rm {or}} relleft ({X, Y} right) = frac {{sum {(x - overline x) left ({y - overline y} right)}}} {{sqrt {sum {{{ (x - overline x)} ^ 2} sum {{{(y - overline y)} ^ 2}}}}}}]
Inside:
({overline x}) and ({overline y}): The average value of samples AVERAGE (array1) and AVERAGE (array2).
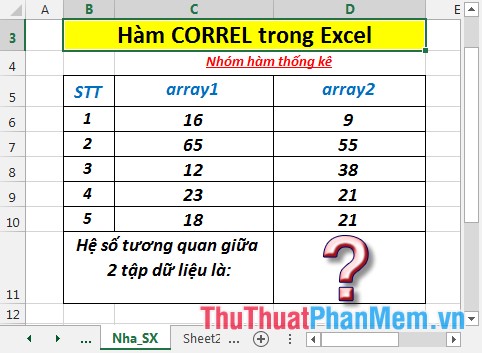
For example:
Calculate the correlation coefficient between the two data sets in the table below:
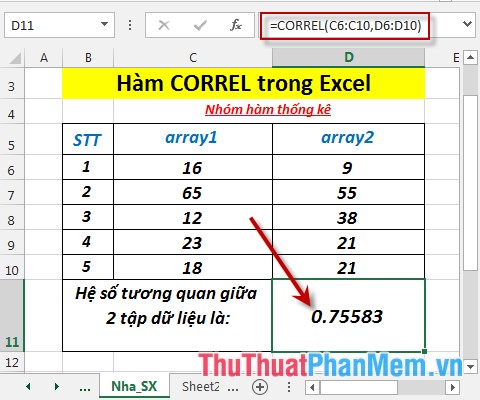
- In the cell to calculate enter the formula: = CORREL (C6: C10, D6: D10)

- Press Enter -> the correlation coefficient between 2 data sets is:
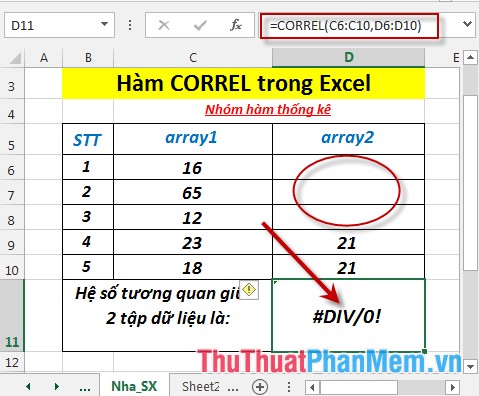
- Case 1 of 2 data sets contains blank values -> the function returns the # DIV / 0 error value !
- Where size = 1 -> the function returns the error value #NUM!
Above are instructions and some specific examples when using the CORREL function in Excel.
Good luck!
Was this article helpful?
Your feedback helps us improve.
Related Articles
 What is the CORREL function in Excel?4 minutes read
 PEARSON function - The function returns the Pearson product moment correlation coefficient in Excel3 minutes read
 RSQ - The function returns the square of the Pearson torque correlation coefficient in Excel3 minutes read
 FISHER function - The function returns the Fissher transformation at x in Excel2 minutes read
 KURT function - The function returns the sharp coefficient of a dataset in Excel3 minutes read
 F.DIST.RT function - The function returns the right probability distribution F for 2 data sets in Excel2 minutes read
Reader Comments 0
Sign in with email or Google to join the discussion.