RSQ - The function returns the square of the Pearson torque correlation coefficient in Excel
RSQ: The function returns the square of the Pearson moment correlation coefficient through data points in known_ys and known_xs. Syntax: RSQ (known_ys, known_xs)
The following article introduces you to the RSQ function - one of the functions in the statistical function group is very popular in Excel.

Description: The function returns the square of the Pearson moment correlation coefficient through data points in known_y's and known_x's.
Syntax: RSQ (known_y's, known_x's)
Inside:
- known_y's : Array or data range, is a required parameter.
- known_x's: Array or range of data points, required.
Attention:
- The value of the argument must be a number, name, array or reference containing numbers.
- Logical values and text number representations when typing directly into the argument list -> still count.
- Arguments that are text or error values cannot be converted to a numeric type -> cause the function to cause an error .
- If the argument is a reference array containing text values or logic -> these values are ignored, but the value 0 is still counted.
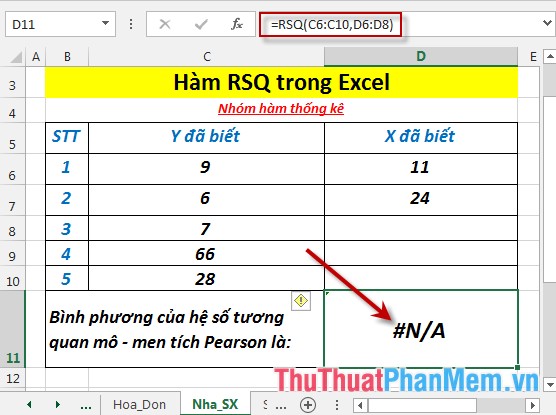
- If known_y's and known_x's are empty or have a different number of data points -> the function returns the # N / A error value .
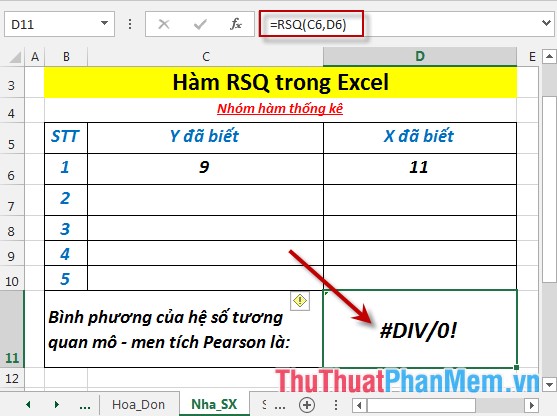
- If known_y's and known_x's contain only 1 data point -> the function returns the # DIV / 0 error value .
- The equation for the Pearson product moment correlation coefficient, r, is:
[r = frac {{sum {left ({x - overline x} right) left ({y - overline y} right)}}} {{sqrt {sum {{{left ({x - overline x} right)} ^ 2} sum {{{left ({y - overline y} right)} ^ 2}}}}}}]
Where x and y are the sample mean AVERAGE (known_x's) and AVERAGE (known_y's).
For example:
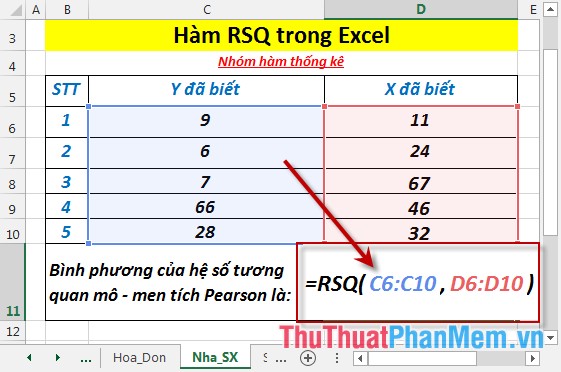
Calculate the square of the Pearson product moment correlation coefficient of values in the following data table:

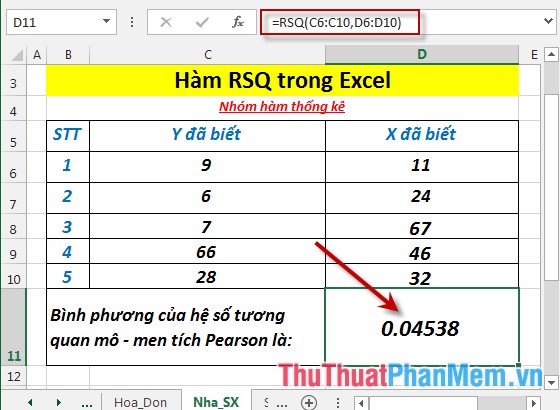
- In the cell to calculate enter the formula : = RSQ (C6: C10, D6: D10)
- Press Enter -> squared the Pearson product moment square coefficient is:
- Where the number of elements of the array x and y is not equal -> the function returns the error value # N / A
- In case of 2 arrays of x and y, there is only 1 element -> the function returns the # DIV / 0 error value .
Above are instructions and some specific examples when using the RSQ function in Excel.
Good luck!
Was this article helpful?
Your feedback helps us improve.
Related Articles
 PEARSON function - The function returns the Pearson product moment correlation coefficient in Excel3 minutes read
 CORREL function - The function returns the correlation coefficient between two data sets in Excel2 minutes read
 FISHER function - The function returns the Fissher transformation at x in Excel2 minutes read
 KURT function - The function returns the sharp coefficient of a dataset in Excel3 minutes read
 What is the CORREL function in Excel?4 minutes read
 The SQRT function returns the square root of a positive number in Excel2 minutes read
Reader Comments 0
Sign in with email or Google to join the discussion.