FISHER function - The function returns the Fissher transformation at x in Excel
FISHER function: The function returns the Fissher transformation at x. This transformation creates a normal distribution function, using this function to test a hypothesis based on a correlation coefficient. Syntax: FISHER (x)
The following article introduces you to the FISHER function - one of the functions in the statistical function group is very popular in Excel.

Description: The function returns the Fissher transformation at x. This transformation creates a normal distribution function, using this function to test a hypothesis based on a correlation coefficient.
Syntax: FISHER (x)
Inside:
- x: Numerical value to convert Fissher .
Attention:
- If x is not a number -> the function returns the #VALUE! Error value .
- If x ≤ -1 or x ≥ 1 -> the function returns the #NUM! Error value
- Fissher transform equation is:
[z '= frac {1} {2} ln left ({frac {{1 + x}} {{1 - x}}} right)]
For example:
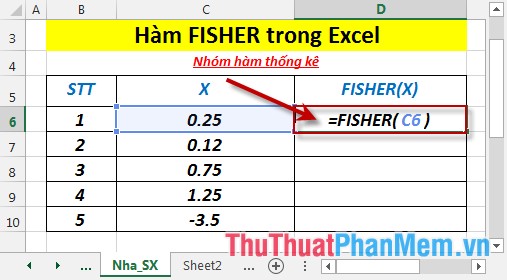
Calculate the value of x after performing the fissher transformation using the data in the following data table:

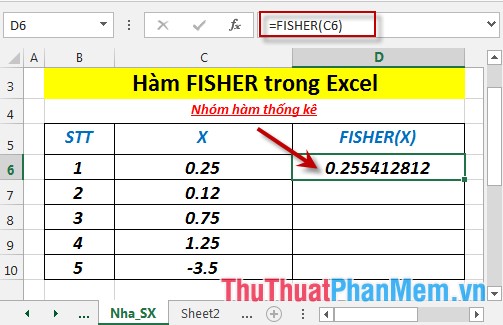
- In the cell to calculate enter the formula : = FISHER (C6)
- Press Enter -> the value of x after performing the fissher transformation is:
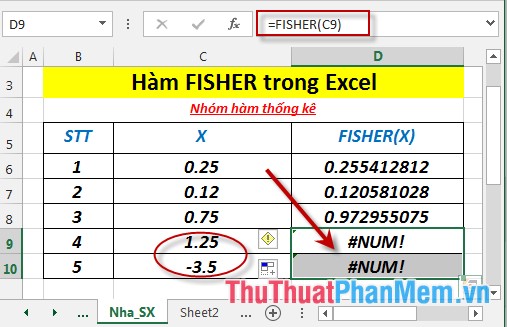
- Similarly copy to the remaining values are results:

- Where x ≤ -1 or x ≥ 1 -> the function returns the #NUM! Error value
Above are instructions and some specific examples when using FISHER function in Excel.
Good luck!
Was this article helpful?
Your feedback helps us improve.
Related Articles
 FISHERINV function - Function that returns the inverse of the Fissher transformation in Excel2 minutes read
 How to use the NORMDIST function in Excel - Function that returns the distribution in Excel3 minutes read
 CHISQ.TEST function - The function returns the independence test in Excel3 minutes read
 How to use the IF function in Excel1 minutes read
 F.TEST function - The function returns the result of the F - test in Excel2 minutes read
 GAMMA function - The function returns the gamma function value in Excel2 minutes read
Reader Comments 0
Sign in with email or Google to join the discussion.