Use VBA in Excel to create and repair PivotTable
PivotTable function is a powerful function of Excel, which helps you to quickly summarize data. This function first appeared in Excel 5. I think you are familiar with creating and editing PivotTable manually and this article will guide you to use VBA to create and fix PivotTable dynamically..
PivotTable function is a powerful function of Excel, which helps you to quickly summarize data. This function first appears in Excel 5.
I think you are familiar with manually creating and repairing PivotTables and this tutorial will guide you to use VBA to dynamically create and repair PivotTables. Article used for Excel 2000.
Suppose in sheet1, I have the data block to be analyzed as shown in Figure 1 . This data block includes fields: SalesRep (sales representative), Region (Region), Month (Month), Sales (sales).

Before creating the PivotTable like Figure 2 , I selected Record New Macro . as shown in Figure 3 , to see how the code is recorded.

 Figure 3
Then I go to VBE screen by pressing Alt + F11 . I entered Module1 , seeing the following code:
Sub Macro1 ()
Macro1 Macro1
Macro recorded 17/03/2003 by Duyet
Range ("A1: D13"). Select
ActiveWorkbook.PivotCaches.Add (SourceType: = xlDatabase, SourceData: = _
"Sheet1! R1C1: R13C4"). CreatePivotTable TableDestination: = Range ("A1"), _
TableName: = "PivotTable1"
ActiveSheet.PivotTables ("PivotTable1"). SmallGrid = False
Note:
Region
A page field in a PivotTable.
SalesRep
Is the row field in the PivotTable.
Month
The column field in the PivotTable.
Sales
A data field in a PivotTable using the Sum function
ActiveSheet.PivotTables ("PivotTable1"). AddFields RowFields: = "SalesRep", _
ColumnFields: = "Month", PageFields: = "Region"
ActiveSheet.PivotTables ("PivotTable1"). PivotFields ("Sales"). Orientation = _
xlDataField
End Sub
Examine the code that has been written:
To investigate the code above you need to know some related objects. All of these objects are explained on online help.
PivotCaches
is a collection of PivotCache objects in the Workbook object
PivotTables
is a collection of PivotTable objects in the Workbook object
PivotTableFields
is a collection of fields in a PivotTable object
Create PivotTable
a method of PivotCache object to create a PivotTable using data in a PivotCache
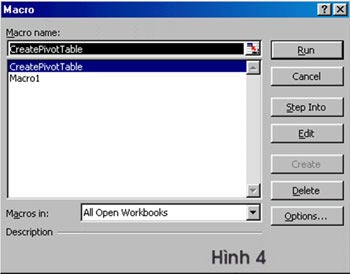
We can rewrite the above procedure using the CreatePivotTable procedure (note that you enter this procedure into module1), it may be a bit long but will be easier to understand, and you can run the program anywhere by pressing Alt + F8 key combination, then select the CreatePivotTable procedure and select Run as shown in Figure 4 .
Sub CreatePivotTable ()
Dim PTCache As PivotCache
Dim PT As PivotTable
Application.ScreenUpdating = False
Rub the PivotSheet at the ear
 On Error Resume Next
Application.DisplayAlerts = False
Sheets ("PivotSheet") Delete
On Error GoTo 0
Tao Pivot Cache
Set PTCache = ActiveWorkbook.PivotCaches.Add _
(SourceType: = xlDatabase, _
SourceData: = Sheets ("Sheet1"). Range ("A1"). CurrentRegion.Address)
Create new worksheet and catalog
Worksheets.Add
ActiveSheet.Name = "PivotSheet"
Tao Pivot Table tu Cache
Set PT = PTCache.CreatePivotTable _
(TableDestination: = Sheets ("PivotSheet"). Range ("A1"), _
TableName: = "PivotTable1")
With PT
Them the schools
.PivotFields ("Region") Orientation = xlPageField
.PivotFields ("Month"). Orientation = xlColumnField
.PivotFields ("SalesRep") Orientation = xlRowField
.PivotFields ("Sales") Orientation = xlRowField
Application.ScreenUpdating = True
End With
End Sub
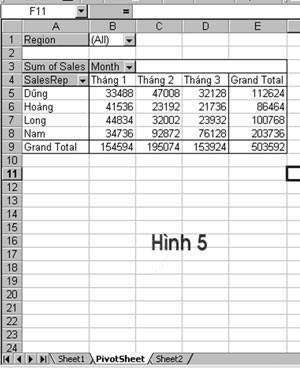
When you finish the above procedure, you will get a PivotTable in sheet2, in this case the sheet is called PivotSheet. ( Figure 5 )
If you pay attention, you will see the difference of the two code above. In Macro1 when using the Add method to create PivotCache , SourceData is " Sheet1! R1C1: R13C4 " and in the code I write Sheets ("Sheet1"). Range ("A1"). CurrentRegion.Address . Here I use the Current Region property , which means that the data we use is based on the current region around cell A1. This is to ensure that the CreatePivotTable procedure continues to work well when we add data.
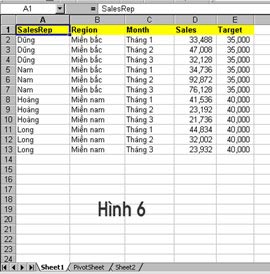
Now suppose I have added the Target field in the data block, and in the PivotTable I will add the target field and also add the Variance calculation field. This field (Variance) will equal Sales - Target . My new data block is shown in Figure 6 .
The code in the CreatePivotTable above procedure will be added as follows (I just added in the With PT . End With paragraph):
With PT
Them the schools
 .PivotFields ("Region") Orientation = xlPageField
.PivotFields ("Month"). Orientation = xlColumnField
.PivotFields ("SalesRep") Orientation = xlRowField
.PivotFields ("Sales") Orientation = xlDataField
.PivotFields ("Target") Orientation = xlDataField
Great news
.CalculatedFields.Add "Variance", "= Sales - Target"
.PivotFields ("Variance"). Orientation = xlDataField
Replace doi caption
.PivotFields ("Sum of Sales"). Caption = "Sales ($)"
.PivotFields ("Sum of Target"). Caption = "Target ($)"
.PivotFields ("Sum of Variance"). Caption = "Variance ($)"
End With
After re-running the above procedure I will be like Figure 7 .
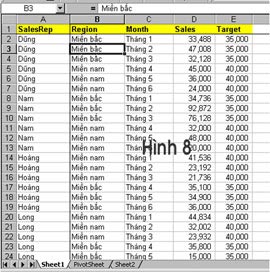
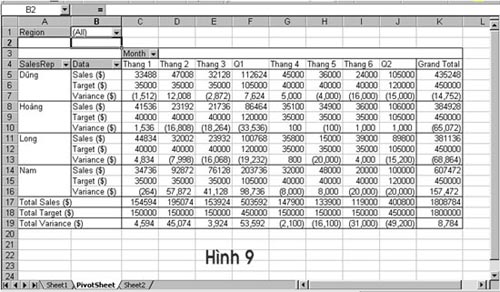
Suppose my data now consists of 6 months ( Figure 8 ), I want to add the total column by 3 months. I have to correct my code as follows:
With PT
Them the schools
.PivotFields ("Region") Orientation = xlPageField
.PivotFields ("Month"). Orientation = xlColumnField
 .PivotFields ("SalesRep") Orientation = xlRowField
.PivotFields ("Sales") Orientation = xlDataField
.PivotFields ("Target") Orientation = xlDataField
Great news
.CalculatedFields.Add "Variance", "= Sales - Target"
.PivotFields ("Variance"). Orientation = xlDataField
Full account
.PivotFields ("Month"). CalculatedItems.Add "Q1", _
"= ladder 1 + ladder 2 + ladder 3"
.PivotFields ("Month"). CalculatedItems.Add "Q2", _
"= ladder 4 + ladder 5 + ladder 6"
Move the files
.PivotFields ("Month"). PivotItems ("Q1"). Position = 4
.PivotFields ("Month"). PivotItems ("Q2"). Position = 8
Replace doi caption
.PivotFields ("Sum of Sales"). Caption = "Sales ($)"
.PivotFields ("Sum of Target"). Caption = "Target ($)"
.PivotFields ("Sum of Variance"). Caption = "Variance ($)"
End With
After re-running the CreatePivotTable procedure I will get the result as shown in Figure 9 .
Well, come here, you see, if we know how to use VBA, data analysis will become simpler. In addition, we can also create a PivotTable from an external data source such as Access. For good PivotTable programming, you should read Excel's online help section on the objects, methods, and attributes mentioned above.
Hopefully the above article will help you in part.
Any suggestions, please send to levanduyet@pmail.vnn.vn.
Le Van Duyet