What is a PivotTable? How to use PivotTable in Excel
Excel's PivotTable is a great tool that Microsoft equips into Excel so users can summarize, analyze, learn and present data more easily. What is a PivotTable? How to use PivotTable in Excel
Table of Contents
Excel's PivotTable is a great tool that Microsoft equips into Excel so users can summarize, analyze, learn and present data more easily.

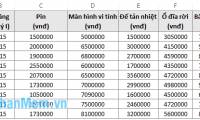
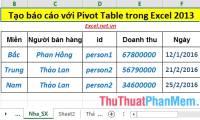
Suppose you have a data spreadsheet with lots of information below:
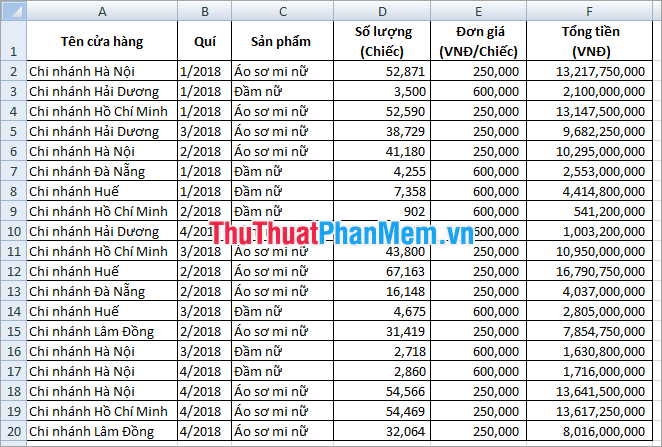
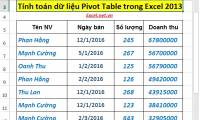
Now you want to aggregate the data by:
+ Revenue of each store,
+ Revenue of each product,
+ Sales by store by quarter,
+ Quarterly revenue for each item,
+ Draw a chart, .
=> The steps are as follows:
Create a PivotTable table
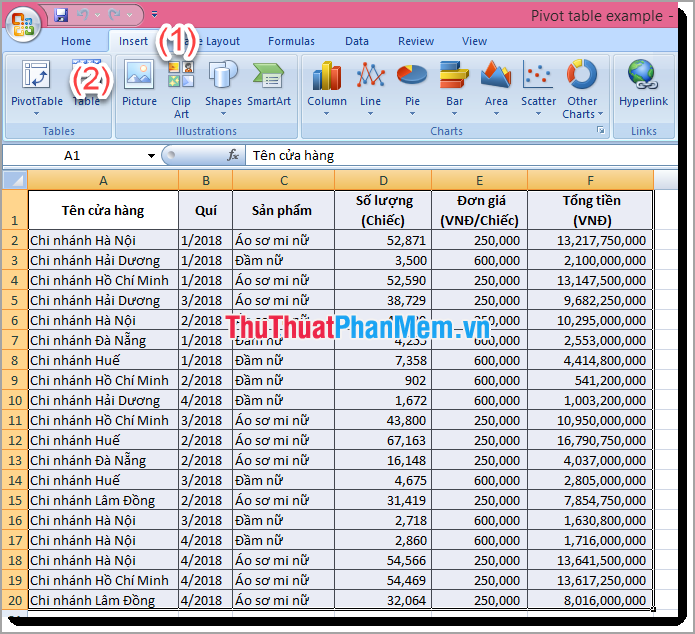
Highlight the entire data area to be processed.
Then select the Insert tab (1) => PivotTable (2) .
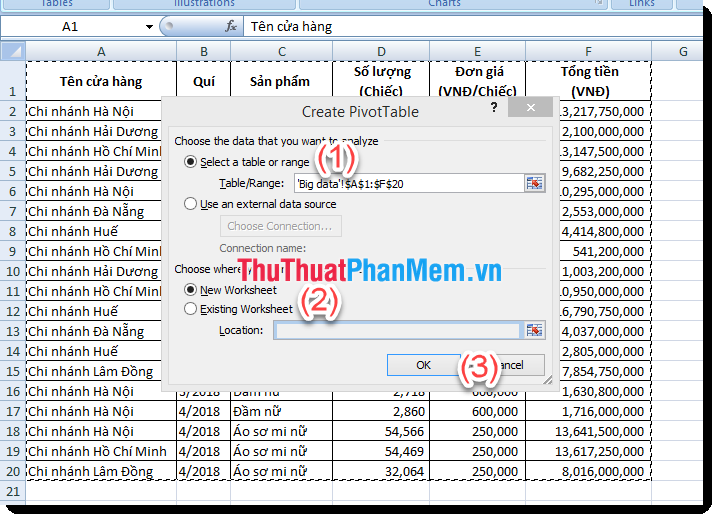
The Create PivotTable window appears.
Select (1) Select a table or range.
(2) You can selectNew WorksheetorExisting Worksheet.
(3) ClickOK.
The PivotTable Fields window appears in the left corner of the screen.
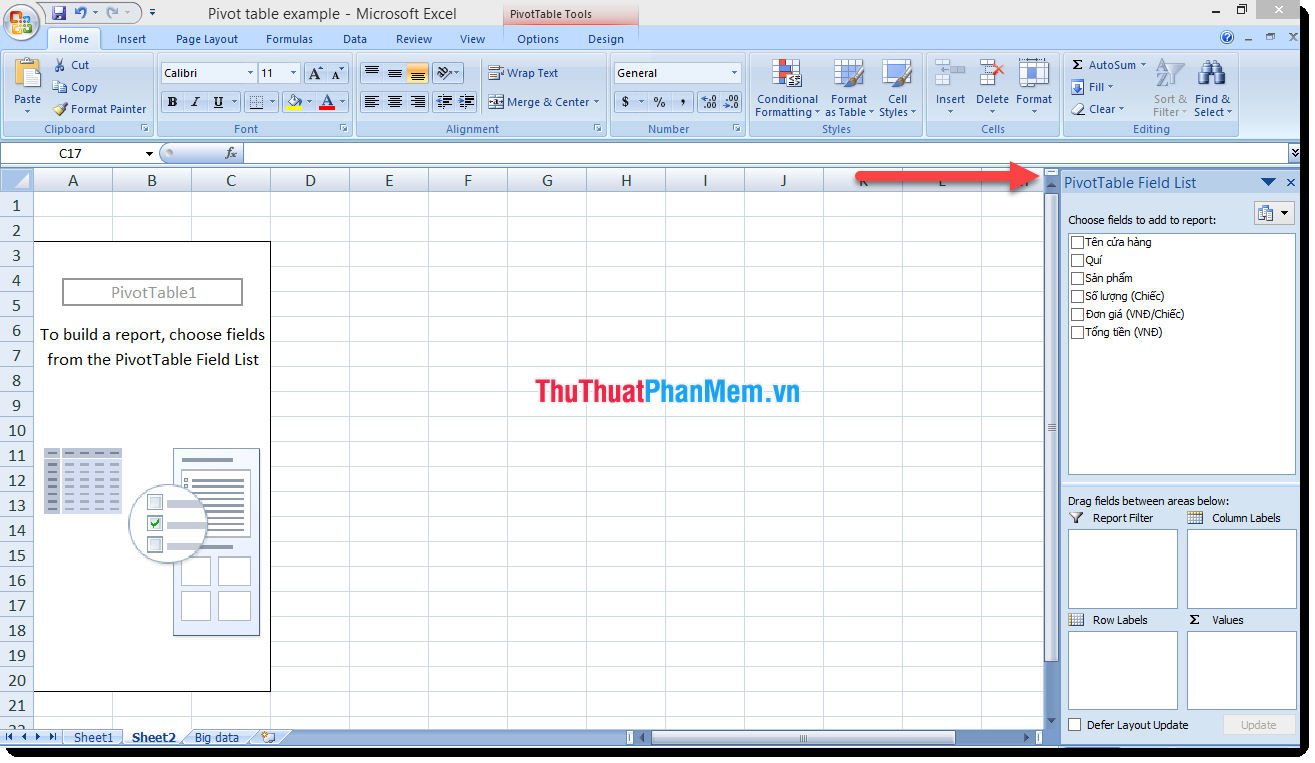
Now our job is drag and drop.
Simple data processing
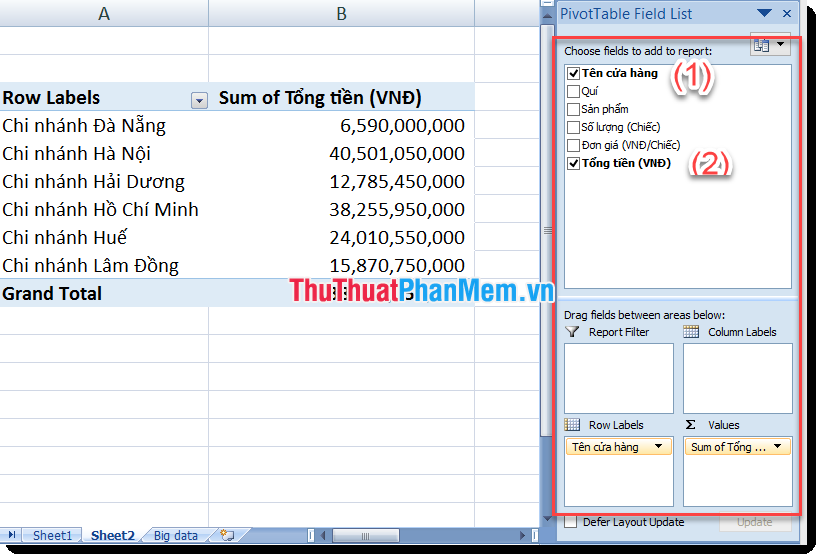
For example, you want to sum the revenue of each store:
- Select the Store Name line to drag it into the Rows box .
- You select the Total money (VND) line and drag it into the Values box .
Data processing under many different conditions / information
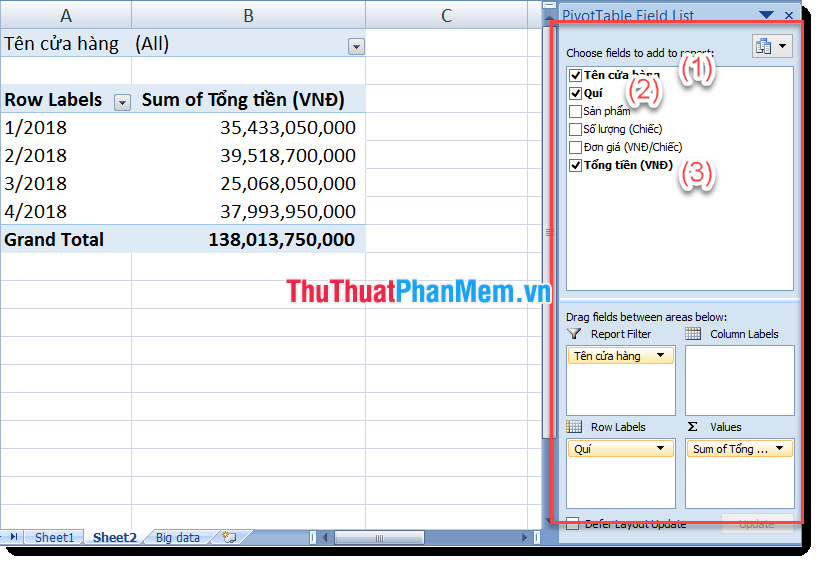
For example, you want to calculate the revenue of each store by quarter :
- Select the Store Name line and drag it into the Filters box .
- You select the line Qui dragged into the Rows box .
- You select the Total money (VND) line and drag it into the Values box .
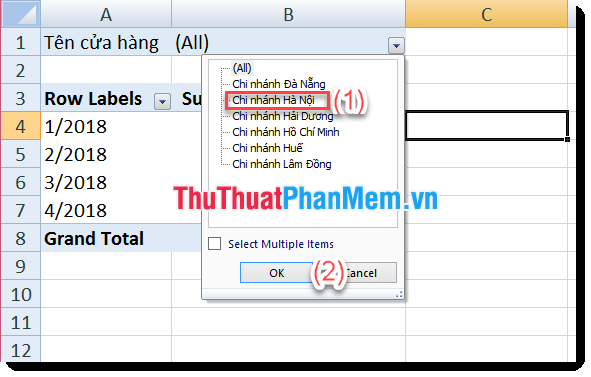
You want to see data of a specific store, select cell B1, click the store you want to see, for example, you select Hanoi Branch (1) => click OK (2) .
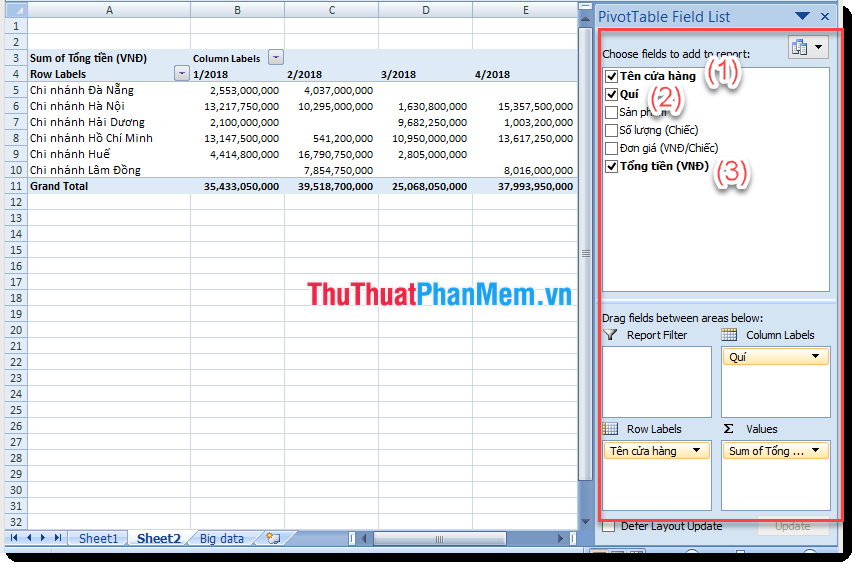
For example, if you want to compare sales between stores by quarter, you can do the following:
- Select the Store Name line to drag it into the Rows box .
- You choose the line You pull into the box Columns.
- You select the Total money (VND) line and drag it into the Values box .
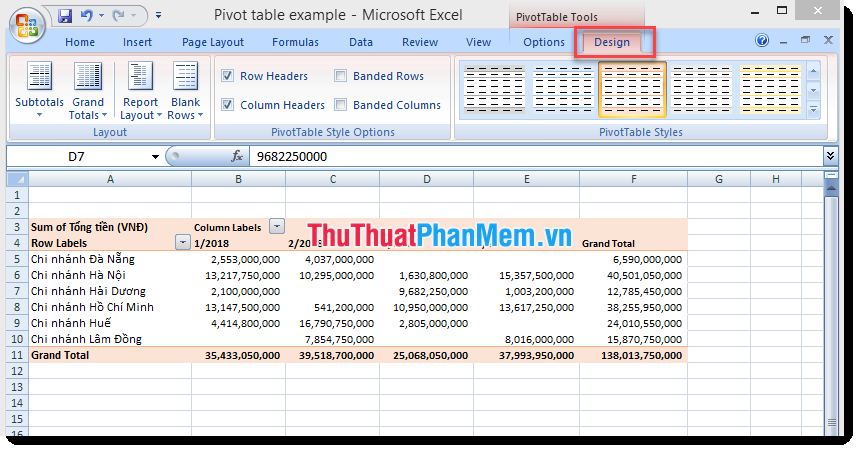
Report format
You can design and reformat the report according to your actual needs by selecting the Design tab and selecting until you like.
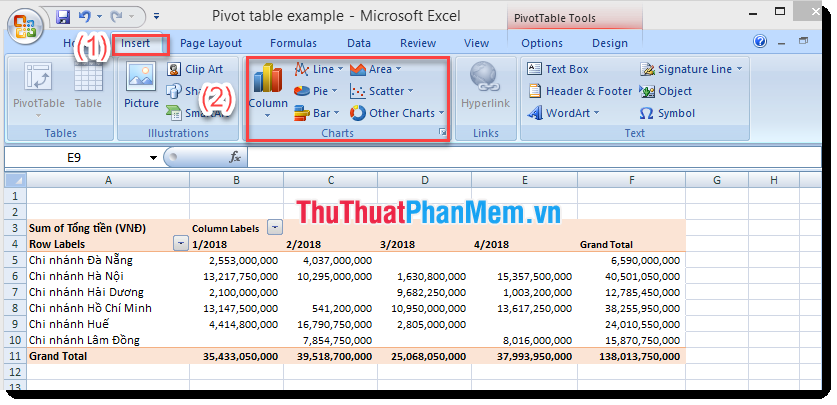
Create PivotChart from PivotTables
Place the cursor in the data area of the PivotTable table, select the Insert tab (1) => Chart (2) .
The Insert Chart window appears, select the chart template you intend to use, and this is the result:
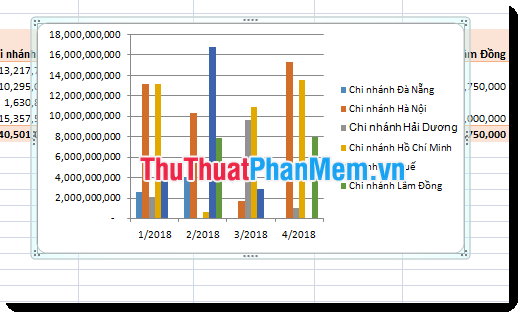
Above are some of the operations to use the basic Pivot table tool to analyze data in Excel, so you can easily synthesize the necessary data, draw charts simply and quickly. The fastest service for your work. Good luck!
Was this article helpful?
Your feedback helps us improve.
Related Articles
 Instructions for using PivotTable in Excel - How to use PivotTable5 minutes read
 Use VBA in Excel to create and repair PivotTable7 minutes read
 Familiarize yourself with PivotTable reports in Excel3 minutes read
 Calculate data in a PivotTable in Excel2 minutes read
 Filter PivotTable report data in Excel5 minutes read
 4 Advanced PivotTable Functions for Excel Data Analysis7 minutes read
Reader Comments 0
Sign in with email or Google to join the discussion.