The following article details array formulas and practical examples to help you better understand and apply them in your work most effectively. To use the array formula you always remember when you enter the calculation formula, press Ctrl + Shift + Enter instead of the Enter key .
1. Array formula to sum by condition, count by condition
For conditional sums we often use the sumif function but to simplify the formula try tracking the example of conditional sum using array formulas.
For example: Calculate the total number of salespeople with a number greater than 38. And calculate the total number of sales of those employees.
There are tables of data:

1.1. Counts the number of employees that sell more than 30 products
In this case, you can use the function counif but here I introduce how to use the Sum array formula. In the cell you need to calculate the following formula: = SUM (B4: B10> 30) .

Press Ctrl + Shift + Enter . Result:

Because the comparison condition returns True or False and uses the Sum function, here you add the following formula:

Press F9 -> Press Ctrl + Shift + Enter to get the results as shown below:

1.2. Conditional sum using array formulas
Calculates the total number of products sold by people who have sold more than 30 products.
Step 1: In the cell to calculate enter the formula.

Press Ctrl + Shift + Enter to get the results:

For some devices, if you enter the above formula without giving the correct results, highlight the parameter in the Sum function -> Press F9 to check the results again -> press Ctrl + Shift + Enter .
2. The array formula used in calculating the maximum difference of stock codes over days
For example: Calculating the maximum and minimum price difference of a stock code by day:

Normally you will create an extra column to find the difference then use the Min and Max functions. In this article, we will use array formulas to calculate without creating an extra column of difference prices.
Step 1: At the cell that needs to calculate the difference, enter the following formula = Max (E5: E10-D5: D10).

After entering the formula, press Ctrl + Shift + Enter to get the results. You can check by highlighting the parameters in the Max function and pressing F9 to check:

Here Max will value in an array of 6 elements.
3. Calculate Max, Min according to conditions combining array formulas
The example here calculates the largest and smallest sales of employees sold during the month. In the cell to calculate the largest sales enter the formula: = Max (If ($ B $ 5: $ B $ 10 = E6, C5: C10)) .

After entering the formula, press Ctrl + Shift + Enter to get the result:

Calculating the smallest sales is the same as the largest sales that is only replaced by the MIN function :

Similarly, you calculate for the remaining employees only to change the If condition that is compared to that employee code.
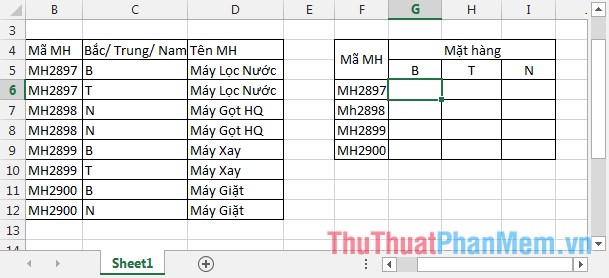
4. Find items that are delivered to agents in the North, Central and South

Using the Index function, match in combination with an array formula.
In the cell to calculate enter the following formula: = IFERROR (INDEX ($ D $ 5: $ D $ 12, MATCH ($ F $ 6 & $ G $ 5, $ B $ 5: $ B $ 12 & $ C $ 5: $ C $ 12,0) ), "") .
After entering the formula, press Ctrl + Shift + Enter to get the results:

Similarly dragging the formula to the remaining cells results:
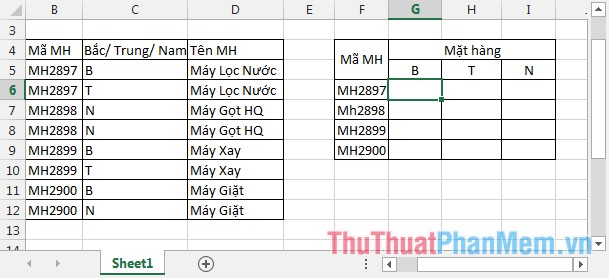
Here, use the IFERROR function to return an error-free result when in the North, the Middle of the Fruit Paring Machine does not have an empty value.
5. Calculate the total cost
For example: Calculating the total cost of items SP1, SP2, SP3 based on the cost table and the number of sp code appearances in the product table sold.
In the cell to calculate enter the formula: SUM (SUMIFS (H5: H7, G5: G7, C5: C9)) .

After entering the formula, press Ctrl + Shift + Enter to get the result:

6. Calculate the total sales of the employees who sold the most
Here you can choose the sum of the n most sold employees with n = 2, 3, 4 .
For example, calculate the total sales of the 3 employees who sell the most.
In the cell to calculate, enter the formula: = SUM (LARGE (C6: C12, {1,2,3})) where {1,2,3} is an array containing the number of elements to sum, here is 3.

After entering the formula, press Ctrl + Shift + Enter to get the result:

For example: Calculate the total sales of the 4 employees with the largest sales by simply adding the 4 element to the array:

7. Use an array formula to number the order to ensure the data components are not deleted
Step 1: Highlight the data range you want to create ordinal numbers -> and above on entering the formula.

After entering the formula, press Ctrl + Shift + Enter to get the result:
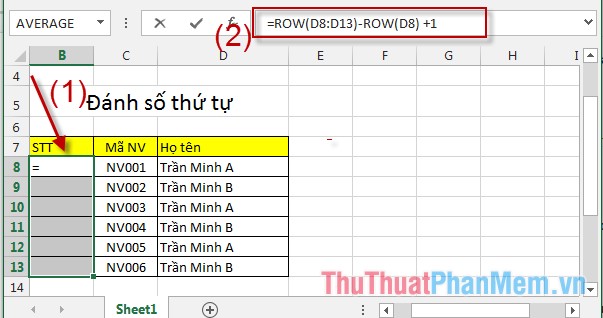
By entering the ordinal number from the array formula to change the composition, the order of the column No. is not changed. For example, one more line: Boi black any line -> Right-click and choose Insert .
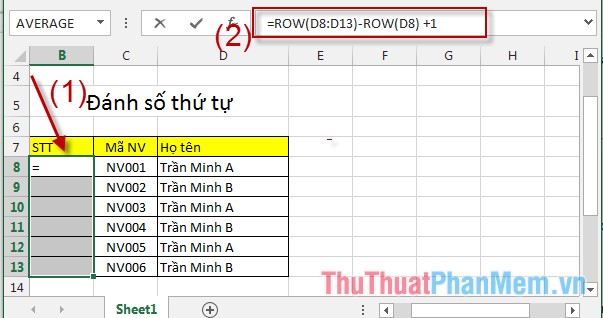
The row numbers 1, 2, 3, 4 and 5 are changed but the ordinal numbers in the ordinal column are not changed.

The above are some examples of how to use array formulas depending on your work of choice.
Good luck!
 How to quickly delete formulas in Excel - Keep the results or delete the results
 Excel 2019 (Part 13): Creating Complex Formulas
 Excel 2019 (Part 12): Introduction to Formulas
 Guide to using AI to create functions and formulas in Canva Sheets
 Types of cell references
 Create complex formulas