New points in Microsoft Office Excel 2007
With a new results-oriented user interface. Microsoft Office Excel 2007 provides rich tools with many features that you can use to analyze, share and manage data easily.
Content of the lesson
-------------------------------------------------- ------------------
> Result-oriented user interface
> More rows, columns and new limits
> Office themes and Excel styles
> Format is richer
> Write formulas easily
> Many power functions and new OLAP formulas
> Improved sorting and filtering
> Table improvements
> New charts
> Sharing chart
> Easy to use PivotTable
> Quick connection with extended data
> New file format
> Better print
> Many new methods of sharing work
> Quick access to many templates
-------------------------------------------------- ------------------
User-oriented results interface
The result-oriented user interface makes it easy to work in Microsoft Office Excel. Many common commands and features that are still hidden in complex menus and toolbars are now easier to find on task-oriented tabs, which include logical logic groups and many features. The dialogs are replaced with a drop-down menu that displays available options, instruction annotations, or preview templates provided to help you choose a reasonable option.
No matter what you are doing in the user interface - whether it is formatting or analyzing data - Excel also shows you the most useful tools to successfully accomplish that task.

All tools are given in task tabs
More rows, columns and new limits
In order for you to exploit large amounts of data in spreadsheets, Office Excel 2007 supports up to 1 million rows and 16,000 columns per spreadsheet. In particular, Office Excel 2007 line systems are 1,048,576 rows and 16,384 columns, they actually provide you with up to 1500% of rows and 6300% of columns compared to Microsoft Office Excel 2003.
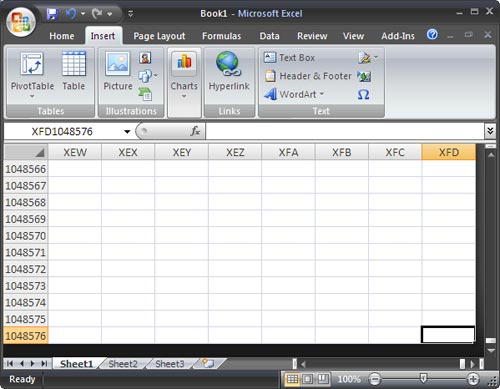
Larger spreadsheet
Instead of 4 thousand types of formats, you can now use unlimited numbers in the same workbook and the number of cells referenced on each cell increases from 8 thousand to the limit allowed by memory.
To improve the performance of Excel, memory management is increased from 1GB in Microsoft Office Excel 2003 to 2GB for Office Excel 2007.
You will also feel faster computing in large formulas with large formulas because Office Excel 2007 supports dual processor sets and multiple chipsets.
Office Excel 2007 also supports up to 16 million colors.
Office themes and Excel styles
In Office Excel 2007, you can format data quickly by applying special Office themes or styles. Office themes can be shared via other Office 2007 programs such as Microsoft Office Word and Microsoft Office PowerPoint, while styles are designed to change the format of special Excel items such as tables, charts, PivotTable, picture or diagram.
Applying the Office theme : Office theme is the initial set of colors, fonts, lines and color effects that can be applied to the entire workbook or special items such as charts or tables. They can help you create great looking documents. Your company may be providing a collective Office theme and you can use it or choose from the predefined Office theme in Excel. You can also easily create your own Office themes and apply them to all Excel or other workbooks in the Office 2007 suite. When creating a theme, colors, fonts and color effects all change separately. turn so you can change part or all of this option.
Using style : style is a predefined theme-based format that you can use to change images of tables, diagrams, diagrams, and PivotTable. If the predefined styles are not satisfied with the needs, you can customize them again. With charts, you can choose from many predefined styles but can't create your own chart styles.
As in Excel 2003, cell types are used to format selected cells, but you can quickly apply them to predefined cell types. Most cell styles are not based on the theme applied to your workbook, but they can also be created easily.
Format is richer
With Office 2007, you can use conditional formatting to interpret data while observing for both presentation and analysis. To easily find outliers and discover important trends in data, you can add and manage multiple conditional formatting rules that apply rich virtual formatting in forms of color gradients and bars. data and symbol sets for data need that principle. Conditional formatting is also easy to apply - in just a few clicks, you can see the relationship that can be used for analysis purposes in your data.
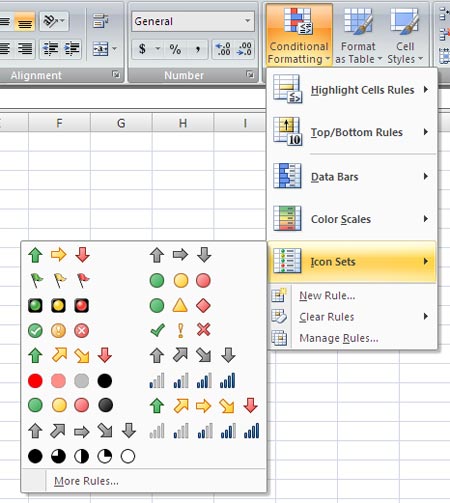
Write formulas easily
The additions to writing formulas become easier in Office Excel 2007.
Formula bar is adjustable in size : The formula bar automatically resizes to help with long, complex formulas, which prevents the formula from covering other data in the spreadsheet. . You can also write longer formulas with more nested levels than you can do in earlier versions of Excel.
Function AutoComplete : With Function AutoComplete, you can write the correct formula syntax quickly. From the easy detection of the functions you want to use to complete the formula argument, you get the right formula.
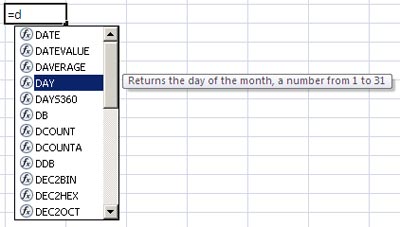
Structured references : With cell references such as A1 and R1C1, Office Excel 2007 provides structural references to refer to ranges of names and tables in a formula.
Easy access to name ranges : By using the name manager of Office Excel 2007, you can organize, upgrade and manage multiple name ranges in central locations, which helps anyone need Working on your spreadsheet must explain its formulas and data.
Many power functions and new OLAP formulas
When you work with multi-size databases (like SQL Server Analysis Services) in Office Excel 2007, you can use OLAP formulas to build complex reports, OLAP data limits, and free forms. charge. New exponential functions are used to extract OLAP data (sets and values) from Analysis Services and display it in a cell. OLAP formulas can be created when you convert PivotTable formulas to cell formulas or when you use AutoComplete for exponent functions when typing formulas.
Improving sorting and filtering
With Office Excel 2007, you can organize spreadsheet data quickly using advanced filtering and sorting. For example, you can classify by color and more than 3 levels (up to 64). You can also filter data by color or by date, display over 1000 items in the AutoFilter drop-down list, select multiple items to filter and filter data in PivotTables.
Table improvements
With Office Excel 2007, you can use the new user interface to make working easier - the interface used to create, format and expand Excel tables (known as an Excel list in Excel 2003) in a way Quick to organize data on spreadsheets. New or improved functions include:
Table header lines : The table header lines can be turned on or off. When the table header displays, they show the data in the column by replacing the header of the worksheet when you move around in a long table.
Calculated columns : Calculated columns use a single formula to adjust for each row. It automatically expands when you add columns so that the formula is expanded to those columns immediately. All you have to do is enter the formula once - you don't need to use the Fill or Copy commands.
Automatic filter (Automatic AutoFiltering) : Automatic filters are turned on by default in a table to allow strong classification and data table filtering.
Structured references : This reference type allows you to use the name of the header table column in the formula instead of referencing cells like A1 or R1C1.
Tatal rows : In the total line, you can use common formulas and text items.
Table styles : You can apply a table style to quickly add a professional, high-quality format to the table, Excel maintains the rotation principle through actions that break this traditional layout as filtering and hiding. Manually or rearrange rows and columns.
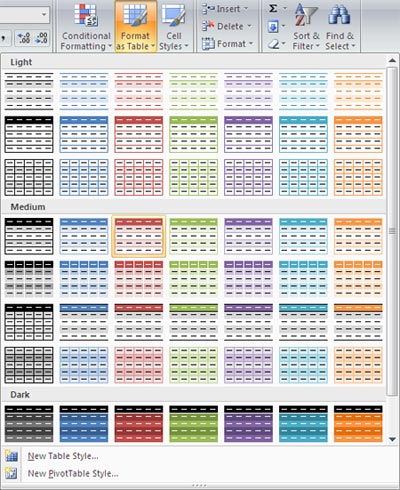
Improvements to the tabular format
New charts
With Office Excel 2007, you can use the new charting tool to create charts that look more professional and allow effective communication. Based on the theme applied to the workbook, newly upgraded charts include special effects like 3-D, projection, and shadows.
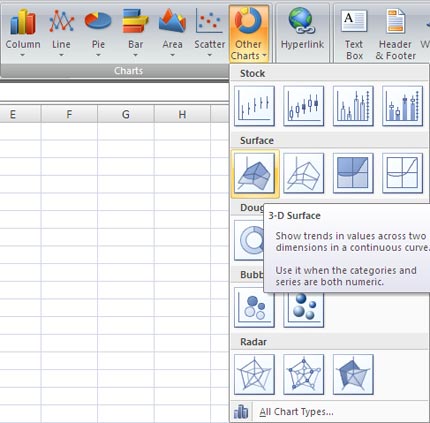
The new user interface makes it easier for software to exploit the types of charts available, so you can create an appropriate chart for your data. Many predefined charts and layouts are provided so you can apply the beautiful format quickly and contain the details you want in the chart.
Box of virtual chart components : Besides the quick layout and formatting, you can also use a new interface to quickly change the element of the chart. With just a few clicks, you can add or remove multiple titles, annotations, data labels and other components of the chart.
A new OfficeArt Because charts in Office Excel 2007 are drawn with OfficeArt, most of the things you can do in OfficeArt can also bring out the implementation for charts and its components. For example, you can add a type of oblique shadow or effect to create a prominent element, or use transparency to create blurry visible elements partially. You can also use realistic 3-D effects.
Lines and fonts are clear : The lines in the charts appear smoother and the ClearType fonts used for text are also improved.
Many colors : You can also choose from predefined colors and change their color density. With better control, you can add your own colors by choosing from 16 million colors in the color box.
Chart templates : Saving your favorite charts as templates becomes easier in a new interface.
Share chart
Using Excel charts in other programs : In Office 2007, charting is shared between Excel, Word and PowerPoint. Rather, using the charting features provided by Microsoft Graph, Word and PowerPoint incorporates Excel's charting features. Because Excel spreadsheets are used as chart data tables for charts of Word and PowerPoint, rich graphing features of Excel can be shared including the use of formulas, filters, and fertilizers. type, and the ability to link a chart with extended data sources such as Microsoft SQL Server and Analysis Services (OLAP) to update information in the chart. Excel spreadsheets include data of charts that can be saved in Word documents, PowerPoint presentations or in separate files to reduce the size of your documents.
Copying charts to other programs : Charts can be easily copied between documents or from one program to another. When copying a chart from Excel to Word or PowerPoint, it automatically changes to match the presentation of Powerpoint and Word documents but retains the Excel chart format. Excel data spreadsheets can be embedded in Word documents and PowerPoint presentations but can also be left in Excel's source file.
Animated charts in PowerPoint : PowerPoint can easily use animation to emphasize data in Excel-based charts. You can create an animation of the entire chart or legend item and axis label. With a column chart, you can animated separate columns to illustrate a specific point more clearly. Animation feature is an easy to find feature and you have many controls on it. For example, you can change the animation steps separately and use many animation effects.
Easily use PivotTables
With Office Excel 2007, PivotTables become easier to use than previous versions of Excel. By using the new PivotTable interface, the information you want to look at is only a few clicks away - you don't have to spend time dragging data and dropping into regions, usually they are not an easy task. easy. Instead you just need to select the fields you want to see in a PivotTable field list.
After you create a PivotTable, you can have many advantages in the new Excel or improved things to summarize, analyze and format PivotTable data.
Using Undo in PivotTables : You can undo most actions you need to create and rearrange a PivotTable.
Drill-down directives plus and minus : These directives are used to indicate whether you can expand or collapse sections of the PivotTable to see more or less information.
Sorting and filtering : Sorting is as simple as selecting an item in the column you want to categorize and using sorting buttons. You can filter data by using PivotTable filters such as Greater than, Equals or Contains.
Conditional formatting : You can apply conditional formatting to Office Excel 2007 Pivot Table with cells or cell lines.
PivotTable style and layout : Like what you can do with Excel tables, you can also quickly apply a familiar or predefined type to a PivotTable. And changing the layout of a PivotTable is much easier for this new interface.
PivotCharts : Like PivotTables, PivotCharts are easily implemented in this new interface. All new improvements in filtering are provided for PivotCharts. When you create a PivotChart, special PivotChart tools and content menus are provided so you can analyze the data in the chart. You can also change the layout, style and format of the chart or its components in the same way you can for normal charts. In Office Excel 2007, the chart formatting that you apply is maintained when you change to PivotChart, which is an upgrade to the way it worked in earlier versions of Excel.
Quick connection with extended data
With Office Excel 2007, you will quickly know the name of the database and the server of the source data in your company. Instead you can use Quicklaunch to select from a list of source data that administrators or expert groups have made available to you. A connection manager in Excel allows you to view all connections in the workbook and make it easier to edit connections.
New file format
XML-based file format: In 2007 Microsoft Office system, Microsoft introduced new file formats of Word, Excel, and PowerPoint known as Office Open XML formats. These new file formats facilitate the integration with source data and also allow for file size reduction and increased data recovery capabilities. In Office Excel 2007, the default format for an Excel workbook is the XML-based file format of Office Excel 2007. Other formats are macro-enabled and XML-based file formats of Office Excel 2007 (.xlsm), defined File format of Office Excel 2007 for an Excel template (.xltx), and format the Excel 2007 macro-enabled Office for an Excel template (.xltm).
Office Excel 2007 binary file format: In addition to new XML-based file formats, Office Excel 2007 also introduces a binary version of the segmented compressed file format for large or complex workbooks. This file format, the binary file format Office Excel 2007 (or BIFF12) (. Xls), can be used to optimize performance options and future compatibility.
Compatibility among Excel versions: You can check the Office Excel 2007 workbook to see if it contains features or formats that are not compatible with the older version of Excel to make the necessary changes. For better compatibility. In an earlier version of Excel, you can install upgrade converters to help you open an Office Excel 2007 document without losing any special functions or features of Office Excel 2007.
Print better
Page Layout View In addition to Normal and Page Break Preview, Office Excel 2007 also provides a Page Layout observation function. You can use this observation to create a spreadsheet while still looking at how it looks when printed. In this observation, you can work with page headers and footers, marginal line settings in spreadsheets and locate objects such as charts and shapes correctly. You can also specify options as quickly as page orientation. Easily follow what will be printed on each page, this will help you avoid having to print it multiple times and cropping the printout from the machine.
Store in PDF and XPS format : You can save as a PDF or XPS file format from a program of Office 2007 suite only after you install an extended add-in package.
Many new methods of sharing work
Use Excel services to share your work: If you access Excel services, you can use it to share your Office Excel 2007 spreadsheet data with everyone who administers. and other shareholders in the organization). In Office Excel 2007, you can share a workbook for Excel services and specify spreadsheet data that you want others to see. In a browser they can use Microsoft Office Excel Web Access to observe, analyze, print and extract this spreadsheet data. Office Excel Web Access has many properties to easily perform tasks such as scrolling, filtering, sorting, viewing charts, and using drill-down in PivotTable. You can also connect Excel Web Access Web Part to other Web Part to display data in different ways. With many reasonable permissions, Excel Web Access users can open a workbook in Office Excel 2007 so they can fully utilize Excel's functions to analyze and work with data on their own computers. If they have installed Excel.
Using this method to share work ensures many people have access to a data version at one location, so that data is always the latest for the same visitor. If you want people (like team members) to give comments and update information, you should share the workbook in the same way that you did with it in previous versions of Excel to choose information that You need to save it to Excel services.
Using document management servers: Excel services can be integrated with document management servers to create a valid process around new Excel reports and workflow calculations in the workbook such as information newspaper based on a cell or a workflow process based on complex Excel calculations.
Quick access to many templates
With Office Excel 2007, you can rely on a new workbook with many different templates installed with Excel or quickly access and download templates from the Microsoft Office online website.
You should read it
- How to import data from photos into Excel
- Complete guide to Excel 2016 (Part 9): Working with multiple spreadsheets
- Basic Office skills in Excel
- Guide to full Excel 2016 (Part 7): Format spreadsheet data
- How to install Word and Excel in Office 2016 only
- Complete guide to Excel 2016 (Part 1): Get familiar with Microsoft Excel
 How to create tables in Office 2003
 Insert some objects into the file content
 'Search' the slide while PowerPoint presentation is in progress
 Use old versions of Office to open and save files created by Office 2007
 How to transfer text code with Unikey
 Portable tips: Customize Menu in Office 2007