DMAX () function (returns conditional maximum value) in Excel
DMAX () is the function that returns the maximum value in a column in a list or database that satisfies the condition that you give.
Table of Contents
As you know, the MAX () function helps you return the largest of the input values. But if you want to get the maximum value that satisfies a given condition, the MAX () function cannot do it. To do that you need to use the DMAX () function, the DMAX () function will help you get the maximum value and satisfy the input conditions.
If you do not know the syntax and usage of the DMAX () function, you follow the article below:
Description
DMAX () is the function that returns the maximum value in a column in a list or database that satisfies the condition that you give.
Syntax
= DMAX (database, field, criteria)
Inside:
- database: list or related database including column headers.
- field: the field (column) needs to get the maximum value. You can enter the column header directly in quotation marks or some representing the column position in the database: 1 for the first column, 2 for the second column, etc., you can also enter the cell containing the required column header. Using example B3, C1 .
- criteria: is the range of cells that contain conditions, you can choose any as long as the range contains at least one column header and the cell below the column header contains conditions for the column.
Note
- You should set the criteria range on the worksheet so that when adding data, the range of conditions does not change.
- The scope of the conditions that need to be separated is not inserted into the list or database to be processed.
- Criteria must contain at least column headers and a cell containing conditions under column headers.
For example
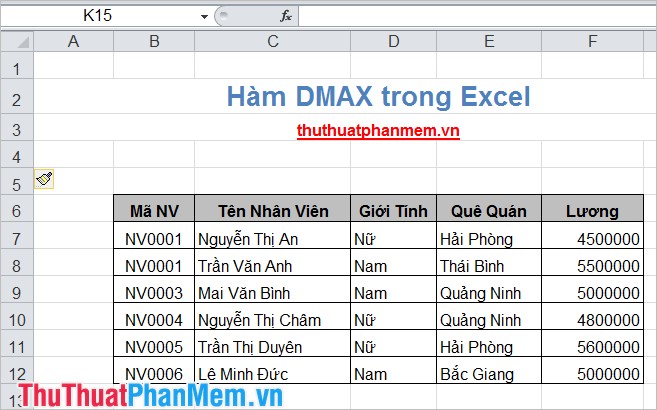
Find the highest salary of female employees in the following data table:
Firstly, facilitating Gender as a Female.
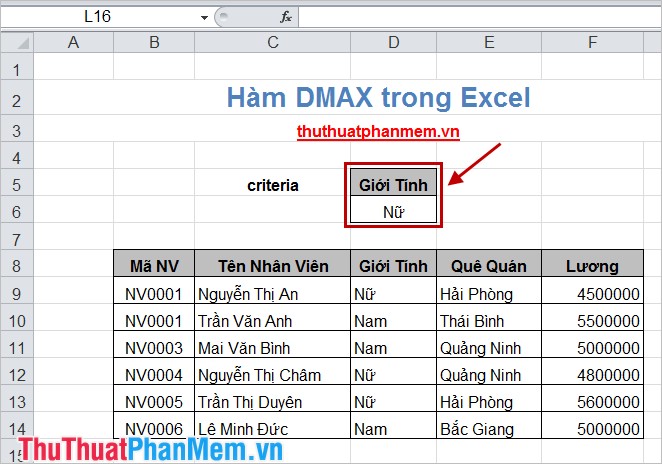
Next apply the DMAX formula:
= DMAX (B8: F14, F8, D5: D6)
B8: F14 is the data table to find the highest salary.
F8 is the Salary column, the column to find the highest salary value.
D5: D6 is the criteria condition area.
Your results will be as follows:

The article has described, presented the syntax and with specific examples hope you will understand and know how to use the DMAX () function in Excel. Good luck!
Was this article helpful?
Your feedback helps us improve.
Related Articles
 Instructions on how to use the Dmax function in Excel4 minutes read
 6 Conditional Functions That Make Excel Spreadsheets Smarter8 minutes read
 DSUM Function: How to Sum with Complex Conditions in Excel5 minutes read
 The IF function in Excel: Syntax and specific examples of the IF function.5 minutes read
 Conditional counting function in Excel4 minutes read
 COUNTIF function: Conditional counting in Excel8 minutes read
Reader Comments 0
Sign in with email or Google to join the discussion.