Some tools to help create online charts
Whether you are a programmer, software developer, graphic designer, architect ... most of the stages in the job are definitely related to creating and drawing charts.
Table of Contents
TipsMake.com - Whether you are a developer, software developer, graphic designer, architect . most of the stages in the job are definitely related to creating and drawing charts. This process is really useful if you want to present an idea, which is difficult to do in any other way . Currently, there are many programs and applications that support charting for the Desktop platform, but in some cases the use of the software is really not convenient and comfortable, for example when You have to move between different computers and offices . In the following article, we will introduce you to 25 online utilities - which are web-based software programs that can Help us a lot in creating, drawing and editing charts.
1. Gliffy.com
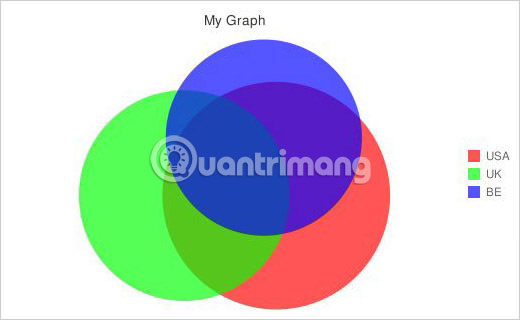
Let's start with the most powerful and flexible program today, it's Gliffy. Users can apply existing template sets or create new files based entirely on demand. So what kind of charts can we create with Gliffy ? The interface interacts with users of the Website or software, Venn diagram, organizational chart, diagram, network system, UML chart . in short, it is very much and varied. And for each type of chart there are many different templates, so the choice of users will not be limited:
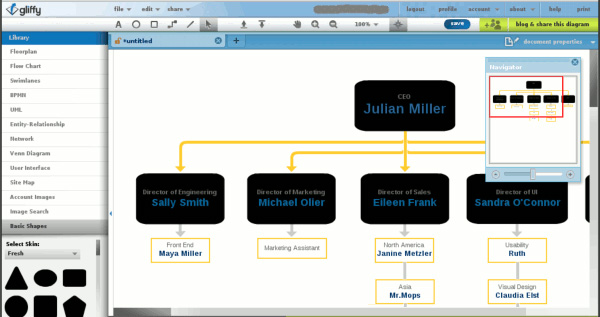
The interface of the application works by dragging and dropping the corresponding objects, and if you want to use the chart with some other document documents, it can be extracted into PNG, JPEG, or SVG format. However, one point to note is that you can only use the first 5 charts for free, and then you want to continue to pay for it.
>>> Video reference:
2. LucidChart.com
If you want to describe the characteristics of LucidChart online tool, it can only be said that it is very simple and very flexible. Built on HTML5 technology, so we can use LucidChart with any browser.
Similar to the above online applications, LucidChart supports convenient drag and drop functionality: corresponding objects and images. After registering an account, you can choose between two forms: free and paid (support more objects and components in the process of use), besides the ability to upload and Save the document as a Visio chart.
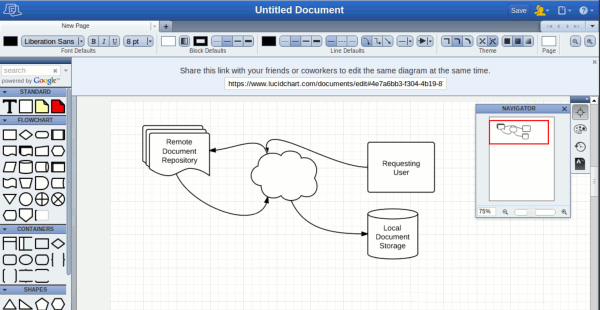
Because it works through the browser, you won't need to worry about having to use different operating systems
>>> Video reference:
3. Livegap.com
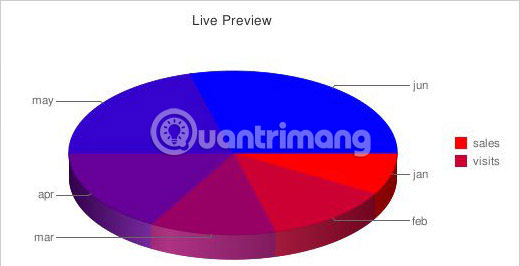
Livegap Charts is a free charting service that provides a live preview of the chart, as soon as you add data to a spreadsheet or upload data from MS Excel. You can choose from a variety of chart types - line, bar, domain, round, etc. No registration or download is required when using the Livegap Charts.
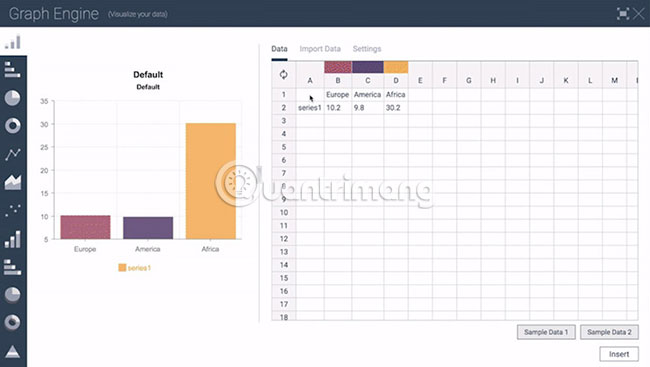
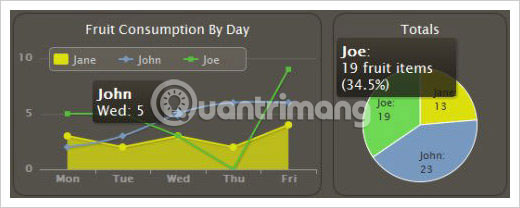
4. Beam
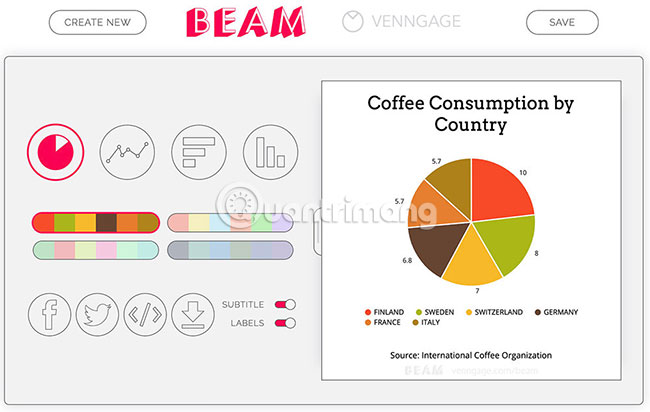
Beam helps users create beautiful and professional charts, in many different shapes, colors and highly customizable. You can share your charts on social networks or embed them in websites or blogs. Data visualization is optimized for mobile devices and is completely free when creating charts.
5. Google Charts
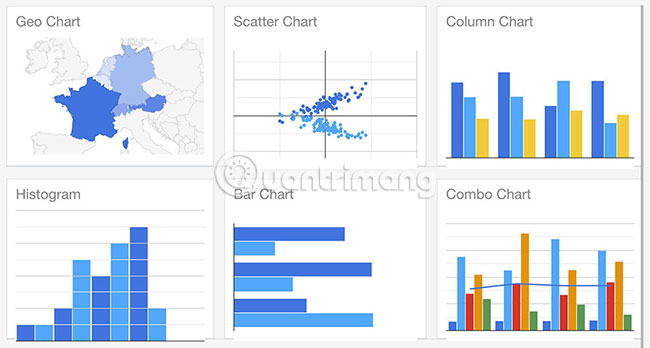
Google provides services in all areas, including data visualization. Google Charts is a free, full-featured tool that is easy to use. You can create interactive charts, choose any option from a diverse library and create dynamic real-time updates.
6. Visme Graph Maker
Visme Graph Maker is free and offers a wide range of powerful features. An easy online tool to create attractive charts, graphs and infographic. You can create animated graphs, turn reports into infographic, choose from many beautiful templates, share data visualization online or download for offline use.
7. RAW Graphs
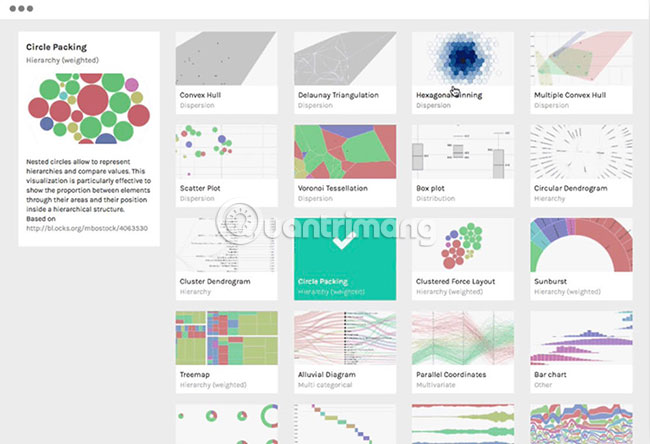
RAW Graphs can turn simple spreadsheets into beautiful charts with just a few simple steps. Just paste the data into this web application, choose a suitable visual model and create a chart. You can check the preview and make any visual changes, modifications or improvements in your favorite vector graphics.
8. DIYChart.com
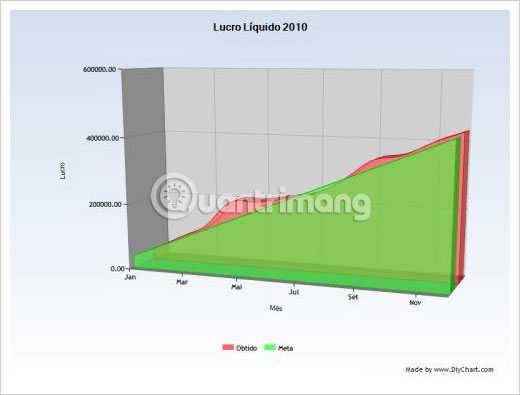
DIY (Do it yourself) Chart is a simple and powerful web-based online tool for creating interactive charts and graphs. You can use static or dynamic data created in any scripting language.
9. Online Chart Generator
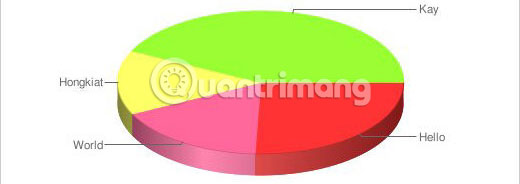
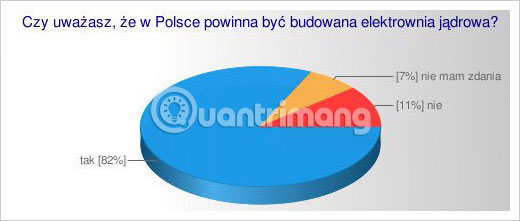
Online Chart Generator is a simple online charting tool, especially suitable for beginners, thanks to the completely easy-to-use interface. You can create amazing 3D graphs in seconds.
Link to reference: chartgen.blogspot.com
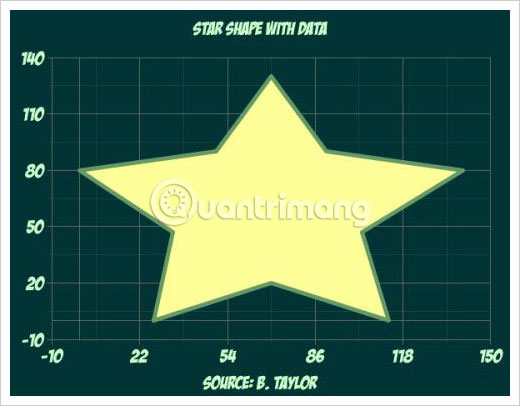
10. Chartle.net
Chartle.net online chart generator eliminates the complexity of data visualization, by providing simple, popular and highly interactive features to users.
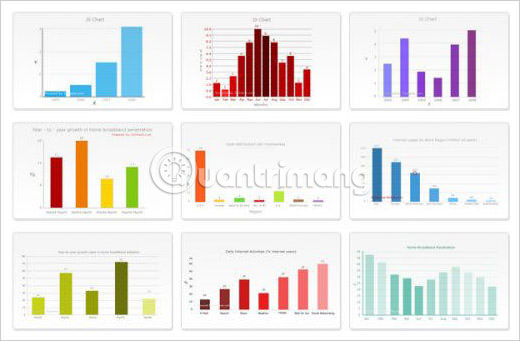
11. ChartGo.com

ChartGo allows users to create charts online at a glance. Just paste the statistics into the chart data area and click the chart creation button.
12. Create A Graph
You can actually create a detailed chart with Create A Graph and see how it looks in the preview. You can then print, download or email the created charts.
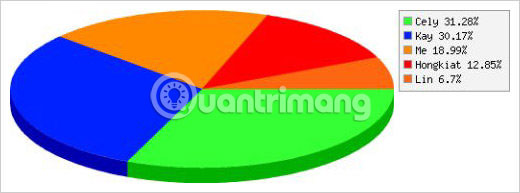
13. JSCharts.com
JS Charts is a JavaScript chart generator that requires little or no programming skills. JS Charts allows you to easily create charts in various templates such as bar charts, pie charts or simple line charts.
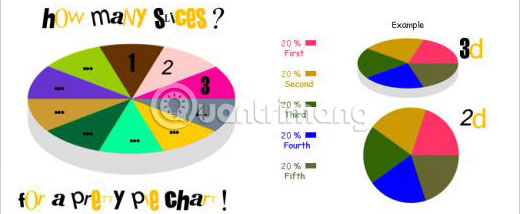
14. Pie Chart Tool
Pie Chart Tool creates a pie chart based on the data you provide. All you have to do is enter the data and names of the categories into the tool and you'll get a nice chart.
15. Piecolor.com
Piecolor is a round chart creation tool with different colors very easily.
16. Hohli Charts
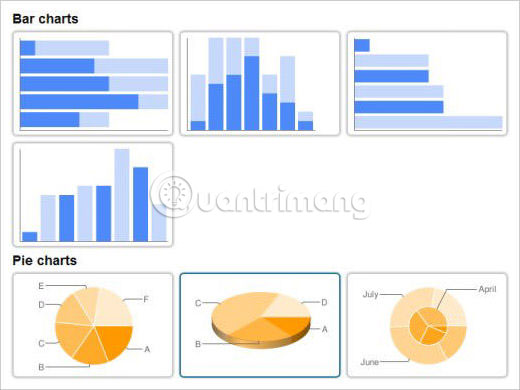
Hohli Charts allows you to automatically create charts. Charts can be created in different sizes and styles.
Link reference: charts.hohli.com
17. Chartpart.com
This charting tool uses the Google Chart API and the user-friendly interface to visually visualize data.
18. Chart Maker
This is an online chart generator for Chart Server API. Just select a chart type, fill in the data and click the Preview button.
19. amCharts Visual Editor
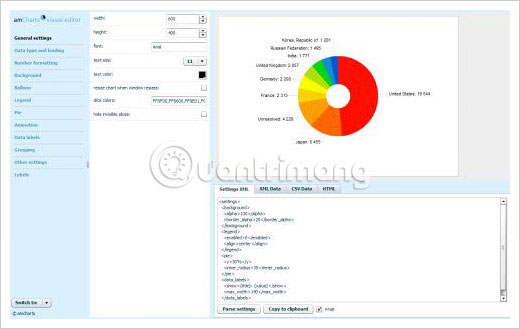
This editor allows you to use amCharts as a web service. This means that all you need to do is configure the chart and paste the generated HTML code into your HTML page.
20. Pie Chart Maker
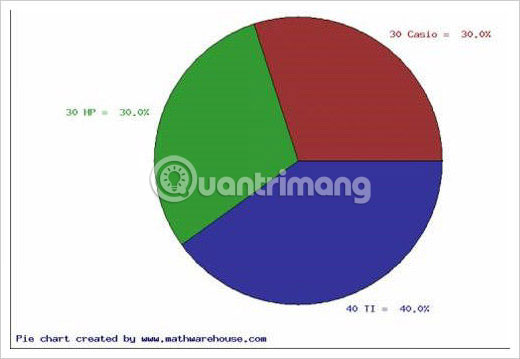
This free tool exports a pie chart as an image that you can save to your computer.
21. ChartGizmo
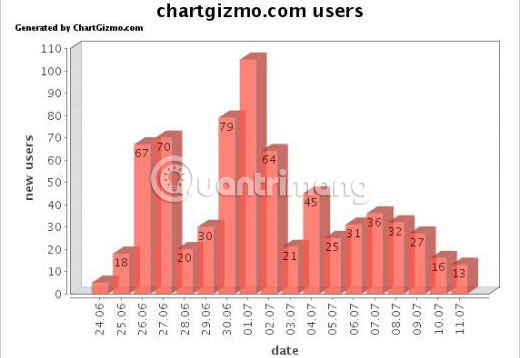
With ChartGizmo free account, you can now create charts and graphs for your website, blog or social networking profile.
22. Onlinecharttool.com

With Onlinecharttool.com, you can design and share your own charts online and for free.
23. OWTChart Generator

OWTChart Generator is an online tool used to create charts. The GIF image of the chart you specified will be displayed on the screen.
Link to reference: maptools.org/owtchart/chartgen.phtml
24. Highcharts
Highcharts is a chart library written in pure JavaScript, providing an easy way to add interactive charts to web pages or web applications. Highcharts currently supports line, column, bar, round, domain and dispersion charts.
25. Google Chart Generator
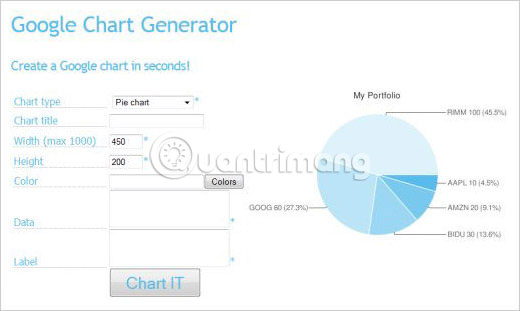
This Google Chart Generator tool can create basic charts in many different display modes in seconds.
Link reference: heavytrader.it/google-chart-generator.php
Wish you find the right tool!
Was this article helpful?
Your feedback helps us improve.
Related Articles
 How to create interactive charts and graphs on your Mac using Numbers8 minutes read
 Instructions on how to create charts in Excel professional7 minutes read
 Instructions for drawing graph functions online3 minutes read
 How to create a graph in Google Slides12 minutes read
 How to draw a map chart on Excel4 minutes read
 Instructions for drawing charts with AI accurately and quickly2 minutes read
Reader Comments 0
Sign in with email or Google to join the discussion.