Instructions for drawing Timeline diagrams on Google Slides
Google Slides has diagram templates for us to insert into the slide to support the content to be presented. For example, you can insert a set diagram in a Google Slides slide, draw a Timeline diagram in Google Slides, etc. Basically, drawing a Timeline diagram in Google Slide is also simple, not too different as when drawing a Timeline diagram in PowerPoint. The following article shows you how to draw a Timeline diagram in Google Slides.
How to draw a Timeline diagram in Google Slides
Step 1:
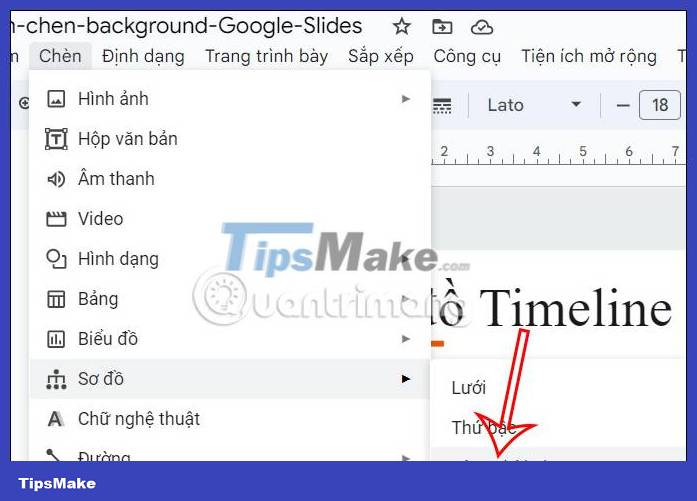
At the slide interface on Google Slides, click Insert and then select Diagram below the list. Now we click on the Timeline diagram type to see the Timeline diagram templates.
Step 2:
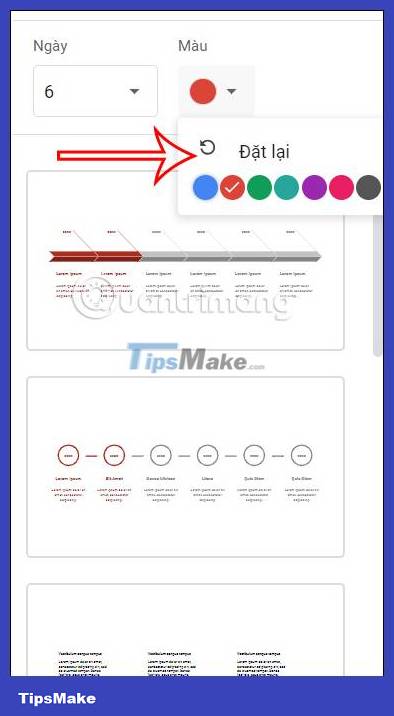
On the right side of the slide interface we will see the Timeline diagram templates that you choose to use for the presentation slide.

Step 3:
You can change the time with the color of the chart you want to choose the Timeline diagram template you need. If you want to use any Timeline diagram template, click on that diagram to insert it into the slide.
Step 4:
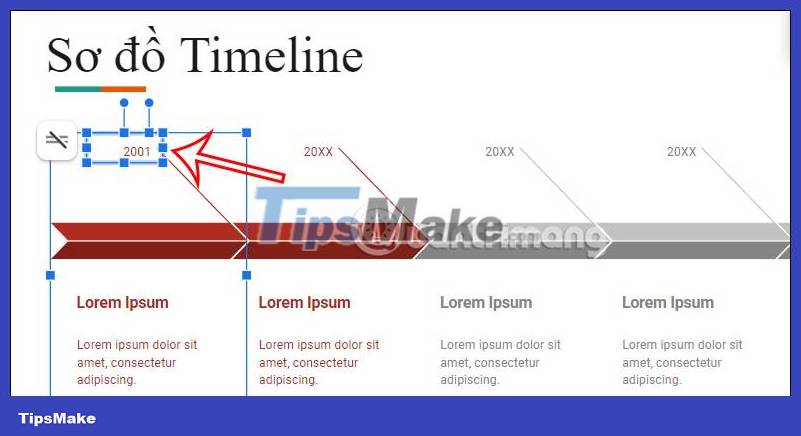
Display the Timeline diagram template in the slide. Now you will change the content and timeline for each process according to the presentation content you need.
We just need to click on the existing content in the diagram and then re-enter our content.
Step 5:
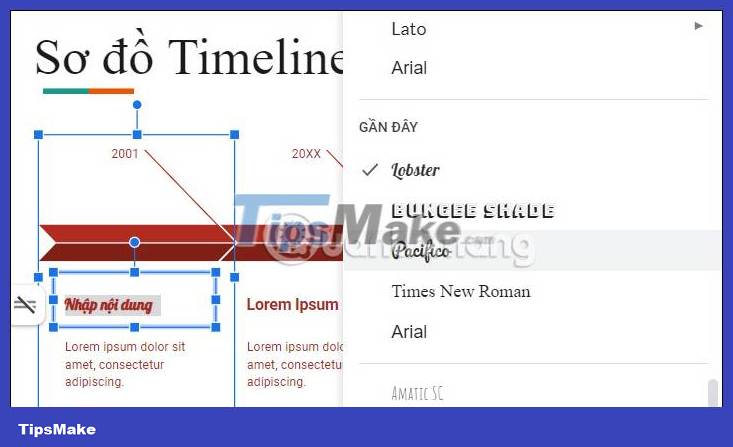
When entering content into the diagram, you also adjust the font, font size, and color for the text as usual.
Step 6:
The Timeline diagram on Google Slides is divided into timelines and you can also change the color at each of those timelines.
Click on the timeline and then click on the object that needs to be changed color .
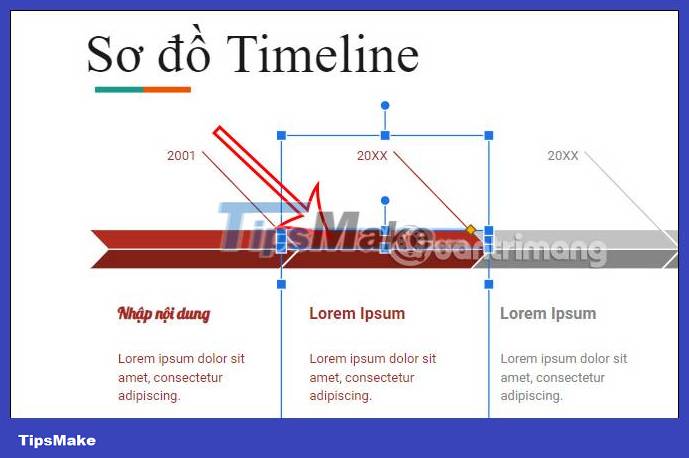
We click on the paint bucket icon and then choose a color to change the color of the object of the timeframe you choose.

Step 6:
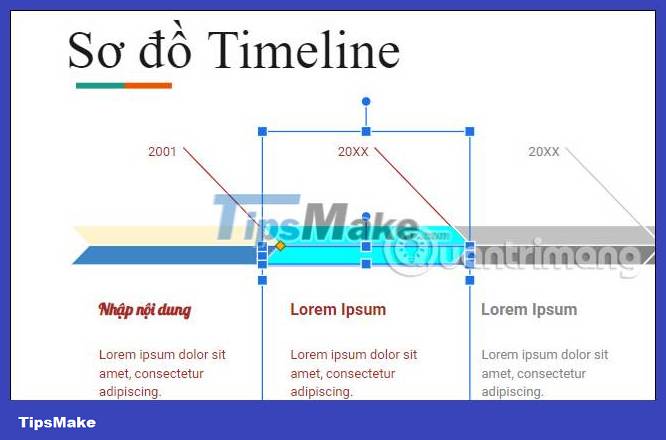
The resulting time bar has changed to color as shown below.
Finally, we adjust the content to our liking to complete the Timeline diagram on Google Slides.
