Instructions on how to edit and delete chart data in PowerPoint
Charts in PowerPoint help present data visually, allowing users to easily edit and delete data as needed. Changes to information can be made quickly through Excel or directly within PowerPoint..
PowerPoint allows for flexible editing and deletion of chart data. You can edit figures, update content, or completely delete parts of the data to suit your presentation needs.
How to edit and delete chart data in PowerPoint
Note: This guide is based on PowerPoint 2016. The process is similar for PowerPoint 2013 and 2010.
1. Create charts in PowerPoint
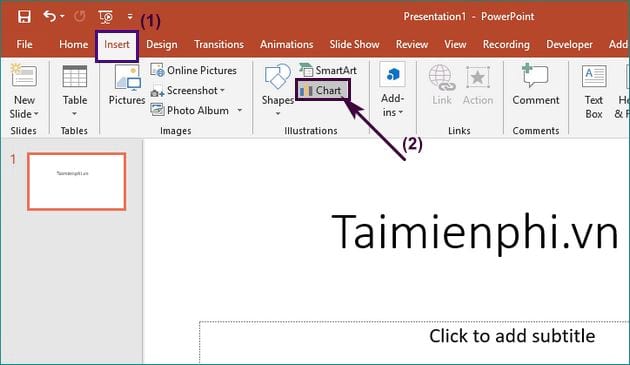
Step 1 : First, open PowerPoint. In the main interface, click on the Insert tab -> select Chart .
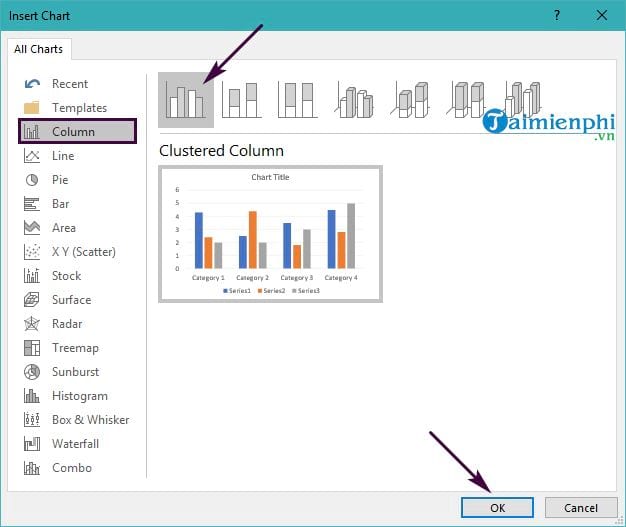
Step 2: The Insert Chart dialog boxappears -> you will see many different chart types to choose from. Click on the chart type you want to use -> then click OK . The image below shows us choosing a bar chart.
You will see a statistical table in Excel appear alongside the PowerPoint presentation. This table allows you to enter data to display as a chart in PowerPoint.
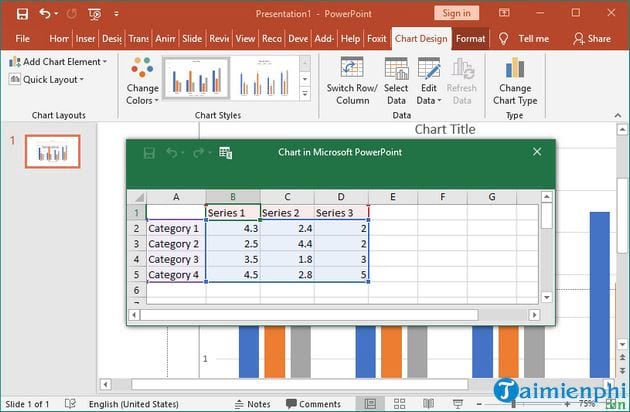
Step 3: Simply enter the data into the fields in the statistical table. Excel will automatically fill in the information you enter, and you will have a chart in PowerPoint.
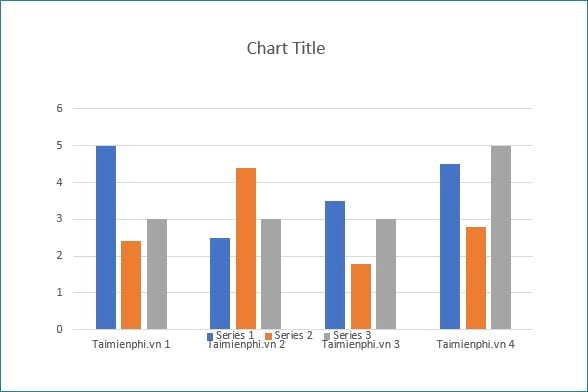
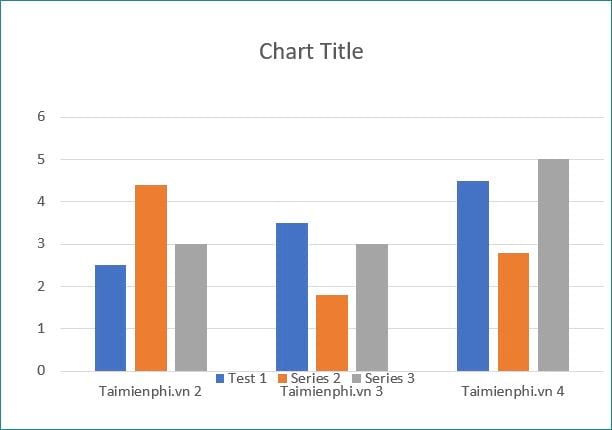
This is the chart in PowerPoint after you have successfully created it.
2. Edit and delete chart data in PowerPoint
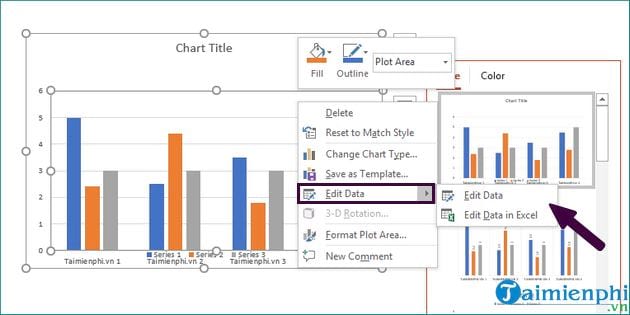
Step 4: To enter or edit data for each column in the chart, right-click on the table, select Edit Data , and then select eitherEdit Data or Edit Data in Excel.
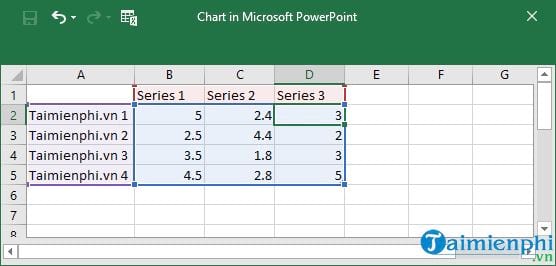
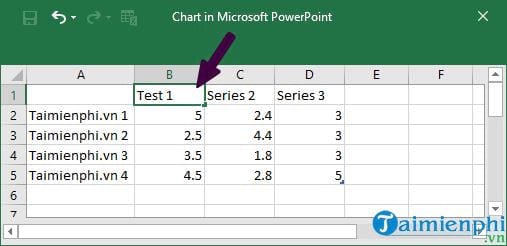
A small Excel spreadsheet will appear. Here, you can select the cell containing the data you want to edit -> then you enter the new value to modify in your chart.
Step 4: If you want to delete data from this chart, select the row containing the data, right-click on the row header, and then select Delete to remove it.
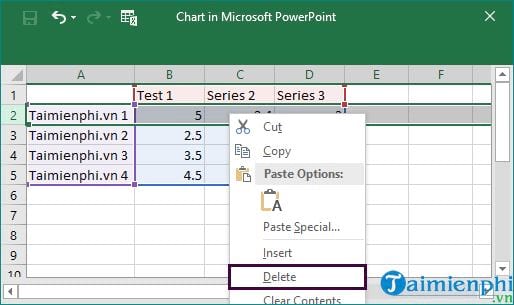
As a result, any data edits or deletions will be excluded from the chart.
The above is a guide on how to easily and quickly edit and delete chart data in PowerPoint. Editing or deleting data from charts allows you to easily update information and ensure accuracy during presentations. If you want to learn more about creating and formatting charts in PowerPoint, explore the display options and how to design visually appealing charts to make your presentations more professional.