Table of Contents
When a Windows 10 connection suddenly slows down, first identify whether an app is transferring data now or has consumed a large amount over time. Task Manager, Resource Monitor, and the Data usage page answer different parts of that question.
Quick comparison
| Tool | Best for | Main limitation |
|---|---|---|
| Task Manager | Finding heavy transfers happening now | Small transfers may round to zero |
| Resource Monitor | Processes, send/receive rates, TCP connections, and listening ports | Primarily a live view |
| Data usage | Comparing cumulative per-app totals | Not a live speed meter |
1. Find current traffic in Task Manager
- Press Ctrl + Shift + Esc. If the compact view opens, select More details.
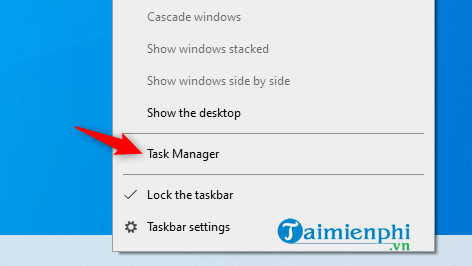
- On Processes, select the Network column heading to sort from highest to lowest.
- Expand an app group to see its child processes. Watch the list for at least a minute because background transfers may be brief.
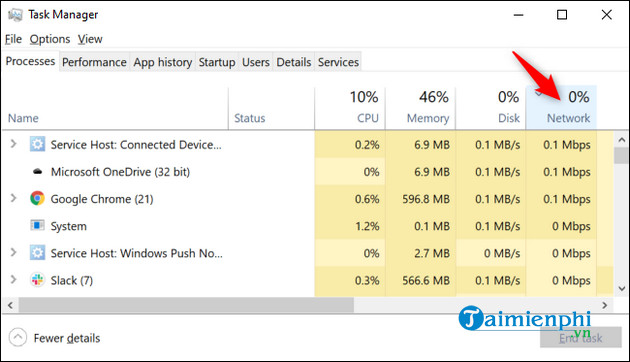
Task Manager shows an approximate current rate in megabits per second. A process shown at 0 Mbps may still be sending a small amount of data. Pause a known download or synchronization task from within its app instead of ending an unfamiliar Windows process.
2. Inspect connections in Resource Monitor
Search Start for Resource Monitor, run resmon, or open Task Manager's Performance page and select Open Resource Monitor. TipsMake also lists other ways to launch Resource Monitor.
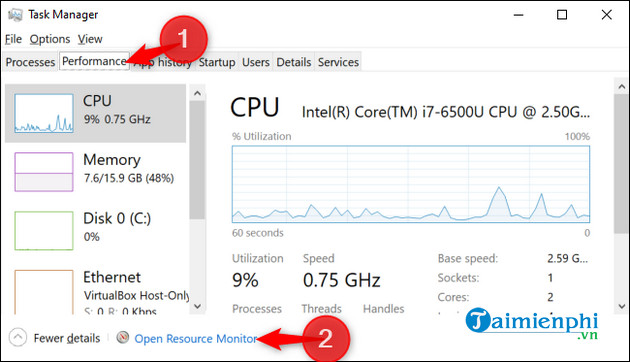
Select the Network tab and review:
- Processes with Network Activity: send, receive, and total bytes per second for each process.
- Network Activity: remote addresses contacted by selected processes.
- TCP Connections: local and remote endpoints, packet loss, and latency where available.
- Listening Ports: programs waiting for inbound connections.
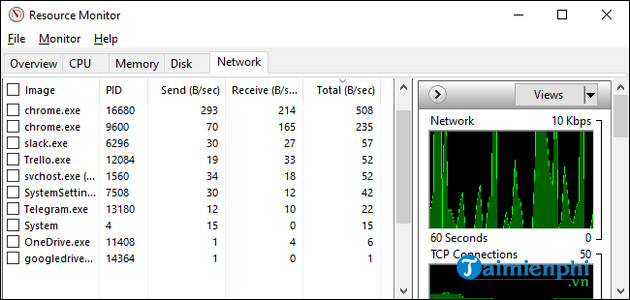
Select the check box beside a process to filter the lower panels. Resource Monitor reports bytes per second, while Task Manager commonly reports bits per second, so their numbers are not directly interchangeable.
3. Review longer-term per-app data totals
Open Settings > Network & Internet > Data usage. Depending on the Windows 10 build, select the active network or View usage per app.
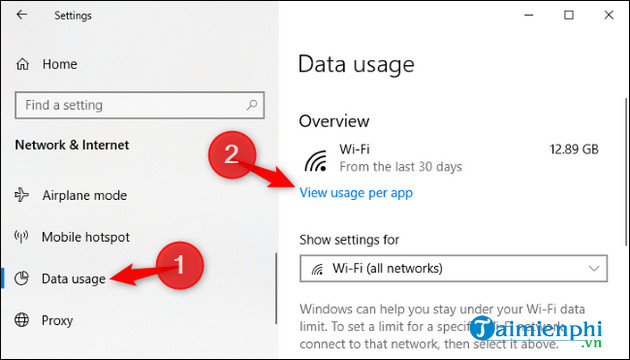
Choose Wi-Fi, Ethernet, or a specific network if the page provides a selector, then compare the apps in the list.
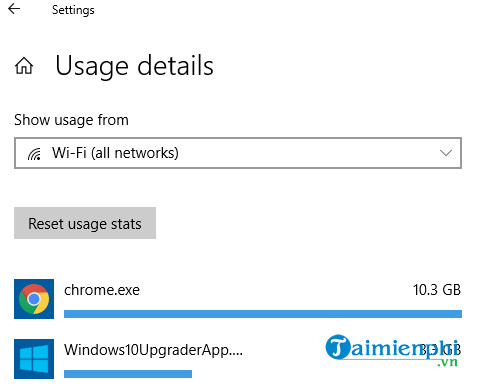
Older Windows 10 builds commonly show a rolling 30-day total; newer layouts show the measurement period on the page. The figures include background and foreground traffic but may not match an ISP's billing system exactly. Windows' broader built-in utility overview provides more context for this counter.
What to do with an unexpected result
- Open the process's file location and check its publisher or digital signature.
- Look for a pending cloud sync, game update, browser download, or Windows update before assuming malware.
- Close or pause the transfer inside the legitimate app, then confirm the rate falls.
- If a process is unknown or behaves suspiciously, scan with Windows Security. Do not delete a file solely because its name is unfamiliar.
- For a connection with a strict allowance, mark it as metered and set a data limit.
For a broader performance investigation, compare CPU, memory, disk, and network activity with the Windows performance tools guide.
Related Articles
 11 Useful Windows Apps That Don't Come Pre - Installed7 minutes read
 12 Apps Windows 11 Users Should Install on Their New PC9 minutes read
 8 Ways to Speed up Network Through Regedit in Windows 1012 minutes read
 7 Old Windows Apps You Need to Stop Using Right Now6 minutes read
 5 Ways to Use SSH in Windows7 minutes read
 7 Best Weather Apps for Windows 10/116 minutes read
Reader Comments 0
Sign in with email or Google to join the discussion.