How to Add Charts in Microsoft Word
Insert charts into Word
Open the Microsoft Word document. To do this, you can double-click an existing Word document, or open Microsoft Word and select the file from the Recent section .
With a new document, simply open Microsoft Word and click Blank document .
Click where you want to insert the chart in the document. The mouse pointer will flash at the spot you just clicked; This is where the chart will be displayed later.
For example, if you click below the paragraph, this is where the chart will be inserted.
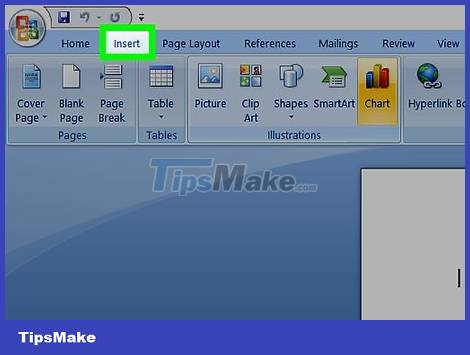
Click the Insert tab at the top of the Word page, to the right of the Home tab .
Click Chart . This option has a multicolored bar icon and is located lower right of the Insert tab .
Click Format chart. This option is listed to the left of the Chart pop-up window
Some common chart formats are line , column , and pie .
You can customize the chart format by clicking the display options at the top of the formatting window.
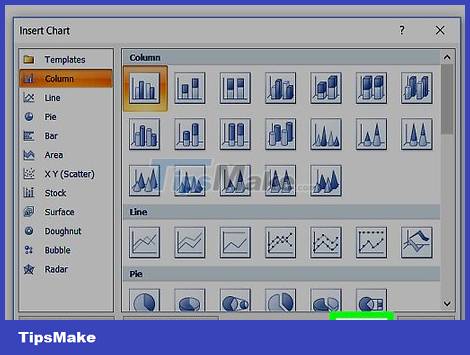
Click OK . The chart will be inserted into the document.
A small Excel window with cells will also appear for you to enter data.
Add data to the chart
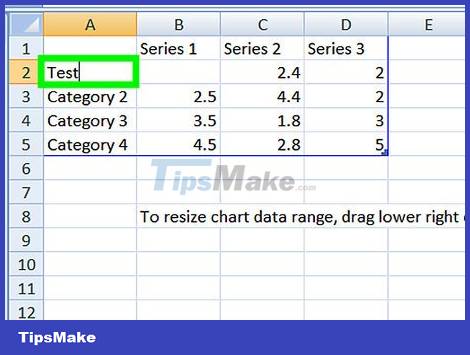
Click a cell in the Excel window. This cell will be selected and you can add data points to it.
Values in column "A" represent data on the X axis of the chart.
Each value in row "1" represents a line or bar (for example, "B1" is a line or bar, "C1" is a line or bar, and so on).
The numeric values outside column "A" and row "1" represent different data points in the Y axis.
All data you enter into an Excel cell will be re-entered to reflect the chart data.
Enter numbers or names.
Press ↵ Enteror ⏎ Return. The data will be entered into the cell, then you will be able to continue with the other cell.
Repeat this process for each data point. As you enter data, the chart changes accordingly.
Click the X button in the upper right corner of the Excel window. This window will close and save the changes to the chart.
You can reopen the Excel window at any time by clicking the chart.
You should read it
- Instructions for inserting, drawing and creating charts in Word 2007
- How to draw a map chart on Excel
- Instructions on how to copy charts from Excel to Word
- Instructions on how to create charts in Excel professional
- Insert and edit charts in Word
- How to Create a 3D Object in Microsoft Word
- How to create funnel-shaped charts in Excel, Outlook, PowerPoint and Word 2016
- Link Download Microsoft Word 2019
May be interested
- How to create funnel-shaped charts in Excel, Outlook, PowerPoint and Word 2016funnel chart displays values across multiple stages in a process. for example, you can use funnel charts to show the number of sales prospects at each stage in a sales plan.
- Link Download Microsoft Word 2019microsoft word is an office software from microsoft. this productivity and business software is capable of producing attractive and beautiful documents. microsoft word comes with all the tools needed to handle documents professionally.
- Work with charts in PowerPoint 2016charts are a tool that users can use to graphically represent data. using a chart in a presentation helps the audience better understand the meaning behind the numbers.
- How to draw charts and graphs in Excel simply and quicklycharts in excel help visualize data and support easy data analysis. you can create bar charts, pie charts, and line charts with just a few simple steps.
- Steps to fix Word Count not showing up in Microsoft Wordthe status bar of microsoft word displays the word count for users to see quickly. as you type in the document, the tool automatically updates the word count. this feature proves to be extremely useful when you need to control so that your content does not exceed a specific number of words.
- Instructions for creating charts on PowerPointdrawing a graph of powerpoint presentations is a basic operation. you can select different chart types for powerpoint presentations such as column charts, line charts, pie charts, bar charts, area charts, scattering charts.
- Instructions on how to draw diagrams in Wordthe use of drawing models in word content will help readers more generalize and better understand the content, as well as increase the content of the content.
- 9 best alternatives to Microsoft Wordmicrosoft word is a very popular word processor. but whether it comes from the cause of cost, approach or hobby, there is an undeniable truth: not everyone likes word.
- MS PowerPoint 2007 - Lesson 7: Insert images and graphics in the slidesmartart is a feature in office 2007 that allows you to select different images and graphics into sile including development charts, list charts, pie charts, process charts, ... in this article tipsmake.com will show you how to insert images into slides and insert data charts into presentations.
- Create a quick dot (……………) line in Microsoft Wordtipsmake.com will guide you how to create a 3-dot line in microsoft word 2016, word 2013, word 2010 and older word such as word 2007, 2003 quickly by using keyboard shortcuts.