BINOM.DIST function - Function returns the probability of binomial distribution of individual terms in Excel
The following article introduces you to the BINOM.DIST function - one of the functions in the statistical function group is very popular in Excel.
Description: The function returns the binomial distribution probability of the individual term. Support function from Excel 2010 version.
Syntax: BINOM.DIST (number_s, trials, probability_s, cumulative)
Inside:
- number_s: number of successes in the test, a required parameter.
- trials: Number of independent trials, required.
- probability_s: The probability of success of each test, is a required parameter.
- cumulative: Logical value determines the form of the function if it is True -> returns the cumulative distribution function, if the False value returns the probability mass function .
Attention:
- If number_ s and trials are not whole numbers they are truncated to whole numbers.
- If number_ s and trials are not numbers -> the function returns the #VALUE! Error value
- If number_s <0 or number_s > trials -> the function returns the #NUM! Error value
- If probability_s <0 or probability_s> 1 -> the function returns the #NUM! Error value
- Binomial probability function is:
[bleft ({x, n, p} right) = left ({begin {array} {* {20} {c}}
n
x
end {array}} right) {p ^ N} {left ({1 - p } right) ^ {n - N}}]
Inside:
(left ({begin {array} {* {20} {c}} nx end {array}} right)): COMBIN (n, x).
- Cumulative binomial distribution function is:
[Bleft ({x, n, p} right) = sumlimits_ {y = 0} ^ N {bleft ({y, n, p} right)}]
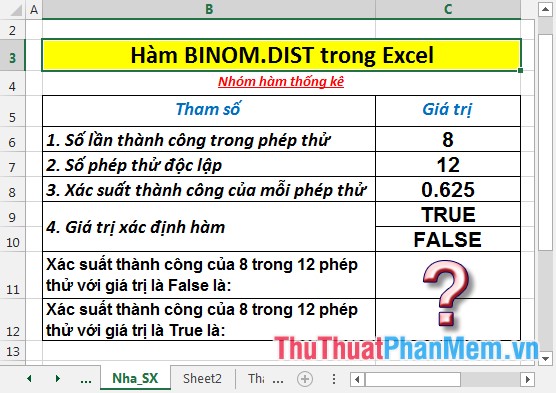
For example:
Calculate the probabilities of the tests with the data in the table below:
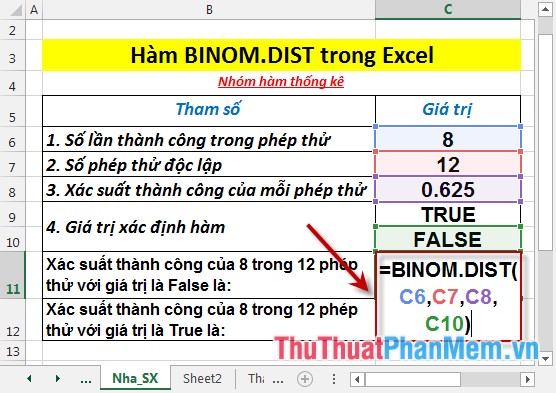
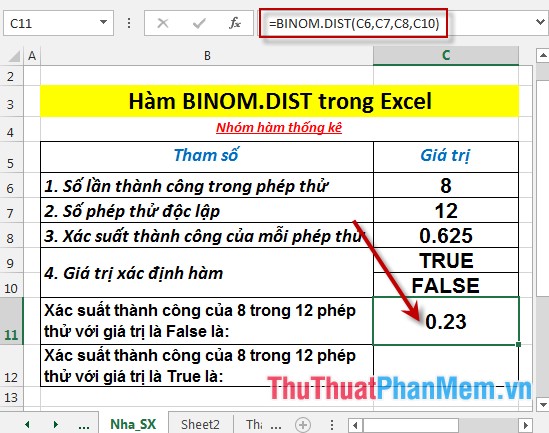
- Calculate the probability of success in 8 of the 12 tests with a value of False. In the cell to calculate enter the formula : = BINOM.DIST (C6, C7, C8, C10)
- Press Enter -> probability of success is:
- Calculate the probability of success in 8 of the 12 tests with a value of True. In the cell to calculate enter the formula : = BINOM.DIST (C6, C7, C8, C9)
- Press Enter -> probability of success is:
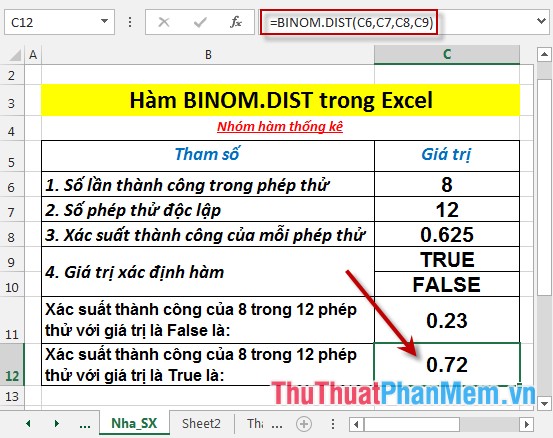
So with different function defined values -> the function returns the same result.
Above are instructions and specific examples when using the BINOM.DIST function in Excel.
Good luck!
You should read it
- F.DIST - The function returns the probability distribution F in Excel
- BINOM.INV function - The function returns the smallest value with cumulative binomial distribution greater or equal to the standard value in Excel
- F.DIST.RT function - The function returns the right probability distribution F for 2 data sets in Excel
- CHISQ.DIST.RT function - The function returns the right end probability of the distribution when squared in Excel
- POISSON.DIST function - The function returns the Poisson distribution in Excel
- GAMMA.DIST function - The function returns the gamma distribution in Excel
- BETA.DIST function - The function returns the Beta distribution in Excel
- HYPGEOM.DIST - The function returns the hyperbolic distribution in Excel
May be interested
- CHISQ.INV function - The function returns the inverse of the probability of the left end of the distribution when squared in Excelchisq.inv function: the function returns the inverse of the probability of the left end of the distribution when squared. support functions from the excel 2010 version. syntax: chisq.inv (probability, deg_freedom)
- GAMMA.INV function - The function returns the inverse of the gamma distribution in Excelgamma.inv: the function returns the inverse of the gamma distribution, using this function to study their distribution variables that may be symmetrical. support functions from excel 2010 onwards. syntax: gamma.inv (probability, alpha, beta)
- CHISQ.DIST.RT function - The function returns the right end probability of the distribution when squared in Excelchisq.dist.rt function: the function returns the probability of the right end of the distribution when squared. support function from excel 2010 version. syntax: chisq.dist.rt (x, deg_freedom)
- T.INV function - The function returns the inverse value of the Student t distribution in Excelt.inv: the function returns the inverse value of the student t-distribution. support functions from excel 2010 onwards. syntax: t.inv (probability, deg_freedom)
- BETA.INV function - The function returns the inverse of the cumulative distribution function for a specified beta distribution in Excelbeta.inv function: the function returns the inverse of the cumulative distribution function for a specified beta distribution. support functions from excel 2010 version. syntax: beta.inv (probability, alpha, beta, [a], [b])
- T.INV.2T - The function returns the two-sided inverse of the Student's t-distribution in Excelt.inv.2t: the function returns the two-sided inverse of the student's t-distribution. support functions from excel 2010 onwards. syntax: t.inv (probability, deg_freedom)
- NORM.INV function - The function returns the inverse of the standard cumulative distribution in Excelnorm.inv function: the function returns the inverse of the standard cumulative distribution with the standard deviation and the specified mean. support functions from excel 2010 onwards. syntax: norm.inv (probability, mean, standard_dev)
- WEIBULL function - The function returns the Weibull distribution in Excelthe function performs the calculation and returns the weibull distribution. based on this distribution to analyze reliability in theory such as calculating the average life of the device or used in the field of meteorology, hydrology and weather forecast.
- ZTEST function - Returns the probability value on one side of the z test in Excelztest function: the function returns the one-sided probability value of the z test. for the hypothetical population mean, the function returns the probability that the sample mean will be greater than the sample mean observed in the data set or array.
- TTEST - Returns the probability associated with a Student's t-Test in Exceldescription: the function returns the one-sided probability value of the z test. for the hypothetical population mean, the function returns the probability that the sample mean will be greater than the sample mean observed in the data set or array.