BINOM.DIST.RANGE function - The function returns the probability of a test result using binomial distribution in Excel
BINOM.DIST.RANGE function: The function returns the probability of a test result using binomial distribution. Support functions from the Excel 2010 version. Syntax: BINOM.DIST.RANGE (trials, probability_s, number_s, [number_s2])
The following article introduces you to the BINOM.DIST.RANGE function - one of the functions in the statistical group is very popular in Excel.

Description: The function returns the probability of a test result using binomial distribution. Support function from Excel 2010 version.
Syntax: BINOM.DIST.RANGE (trials, probability_s, number_s, [number_s2])
Inside:
- trials: Number of independent trials, required.
- probability_s: The probability of success of each test, is a required parameter.
- number_s: The number of successes in a test must be greater than 0 and less than or equal to the number of trials, which is a required parameter.
- number_s2: Returns the probability that the number of successful trials will fall between number_s and number_s2, which is an optional parameter and number_s < number_s2
Attention:
- If any values of arguments are not whole numbers -> they are truncated to integers.
- If any argument is out of bounds -> the function returns the #NUM! Error value .
- If number_ s and trials are not numbers -> the function returns the #VALUE! Error value
- If number_s <0 or number_s > trials -> the function returns the #NUM! Error value
- If probability_s <0 or probability_s> 1 -> the function returns the #NUM! Error value
- The function uses the equation:
[sumlimits_ {k = S} ^ {S2} {left ({begin {array} {* {20} {c}} N k end {array}} right) {p ^ k} {{left ({1 - p } right)} ^ {N - k}}}]]
Inside:
N is the test, p is the probability of success, s is number_s, s2 is number_s2.
For example:
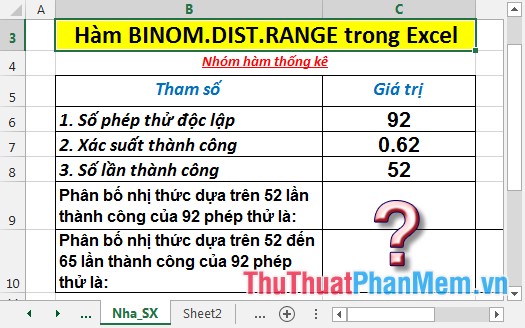
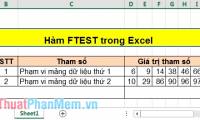
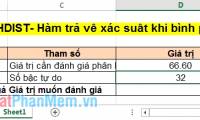
Calculate the probability of success of the tests with the data in the following table:
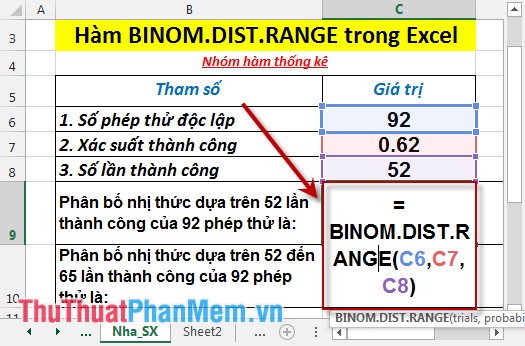
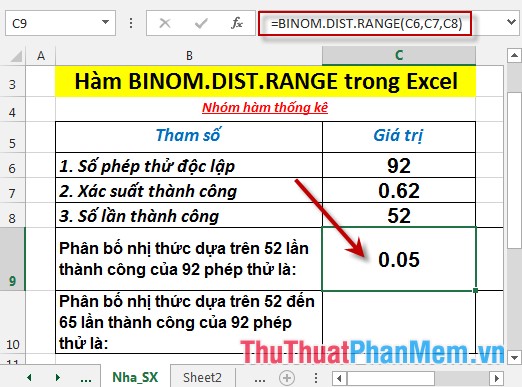
- Calculate the binomial distribution based on the successful 52 times of 92 tests . In the cell to calculate enter the formula : = BINOM.DIST.RANGE (C6, C7, C8)
- Press Enter -> probability of success is:
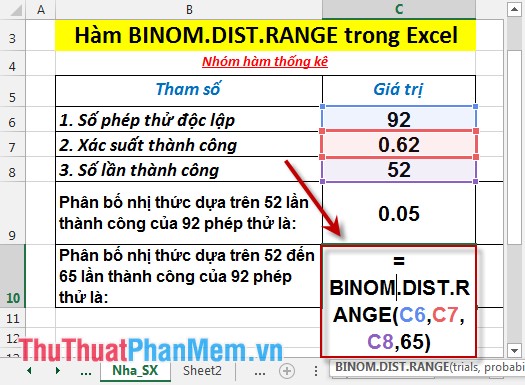
- Calculate the binomial distribution based on the successful 52 to 65 times of 92 tests . In the cell to calculate enter the formula : = BINOM.DIST.RANGE (C6, C7, C8,65)
- Press Enter -> probability of success is:

Above are instructions and specific examples when using the BINOM.DIST.RANGE function in Excel.
Good luck!
Was this article helpful?
Your feedback helps us improve.
Related Articles
 BINOM.DIST function - Function returns the probability of binomial distribution of individual terms in Excel3 minutes read
 NEGBINOM.DIST function - Function returns the negative binomial distribution in Excel2 minutes read
 F.TEST function - The function returns the result of the F - test in Excel2 minutes read
 FTEST function - The function returns the result of an F-Test in Excel3 minutes read
 CHIDIST function - Function returns the right end probability of the distribution when squared in Excel2 minutes read
 F.INV.RT function - The function returns the right-inverse head value of the probability distribution F in Excel2 minutes read
Reader Comments 0
Sign in with email or Google to join the discussion.