TTEST - Returns the probability associated with a Student's t-Test in Excel
Description: The function returns the one-sided probability value of the z test. For the hypothetical population mean, the function returns the probability that the sample mean will be greater than the sample mean observed in the data set or array..
The following article details how to use the ZTEST function - The function to calculate the one-sided probability value of a z test.
Description: The function returns the one-sided probability value of the z test. For the hypothetical population mean, the function returns the probability that the sample mean will be greater than the sample mean observed in the data set or array.
Syntax: ZTEST (array, x, [sigma]) .
Inside:
- array : An array or range of data to test for x, which is a required parameter.
- x : Value to check, required parameters.
- sigma : The overall standard deviation, if omitted the default value is the sample standard deviation, is an arbitrary parameter.
Attention:
- If array array is empty -> the function returns the # N / A error value.
- ZTEST function is calculated based on the formula:
+ Where sigma is used:

+ In case of omitting sigma parameter:

- ZTEST function indicates that the probability that the sample mean will be greater than the observed value is AVERAGE (array) when the average of the basic population is μ0 => ZTEST will return a value greater than 0.5 when AVERAGE ( array) < μ0 .
- You can use the ZTEST function to calculate the probability of 2 sides based on the formula:
2 * MIN (ZTEST (array, μ0, sigma), 1 - ZTEST (array, μ0, sigma)) .
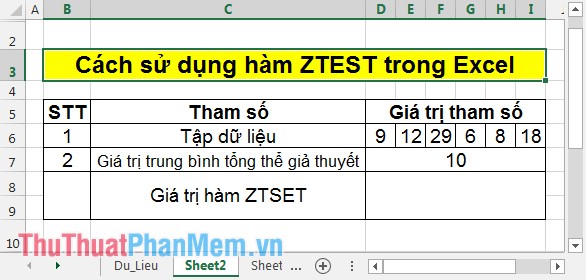
For example:
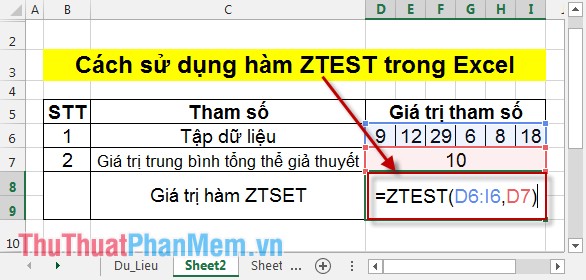
Step 1: In the cell to calculate enter the formula: = ZTEST (D6: I6, D7) .
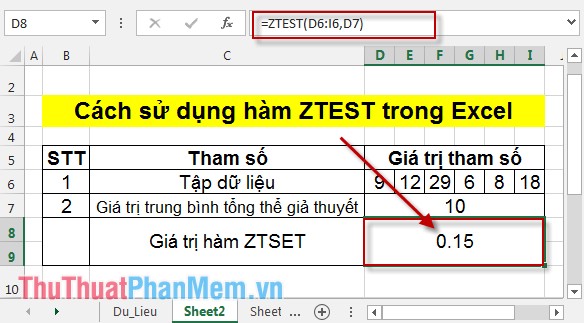
Step 2: Press Enter -> ZTEST function value is:
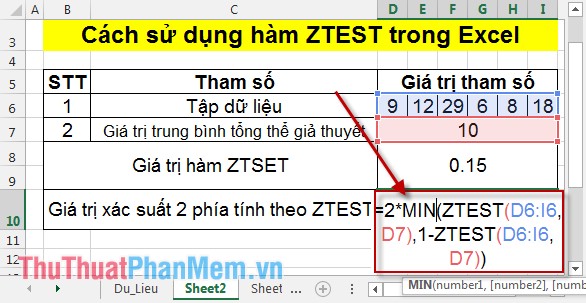
In addition, you can also calculate the 2-sided probability based on the ZTEST function :
Step 1 : In the cell to calculate, enter the formula: = 2 * MIN (ZTEST (D6: I6, D7), 1-ZTEST (D6: I6, D7)) .
Step 2: Press Enter -> the value of the ZTEST function on both sides is:

Above is a detailed guide of meaning, usage and some notes when using ZTEST .
Good luck!