PERCENTILE function - The function returns the kth percentile in Excel
In mathematical computing, the percentile is a frequently applied process to study the percentile of values in a defined data set. The following article details how to use the PERCENTILE function to calculate the kth percentile value.
Description: The function performs returning the kth percentile of values in the specified array or data range.
Syntax: PERCENTILE (array, k) .
Inside:
- array: An array or range of data to determine percentile for values, which is a required parameter.
- k: Percentage value to determine rank, is a required parameter. The value of k ranges from 0 to 1 including 1.
Attention:
- The value k must be in paragraph [0,1] otherwise the function returns the #NUM! Error value.
- If the value k is not in the form of numbers, the function returns the error value #VALUE!
- The case when k is not a multiple of 1 / (n-1) PERCENTILE function will interpolate to calculate percentile value.
For example:
Find the value of 0.9 percentile in the data array:
In the cell to calculate the value enter the formula: = PERCENTILE (D13: L13, D14) -> Press Enter the result received is:
So the 0.9th percentile has a value of 28.
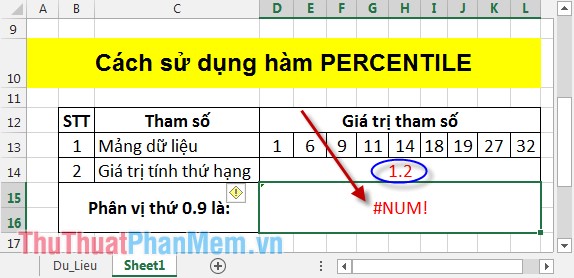
Note: When entering the percentile value is always greater than or equal to 0 and less than or equal to 1. If the percentile value is greater than 1 error function:
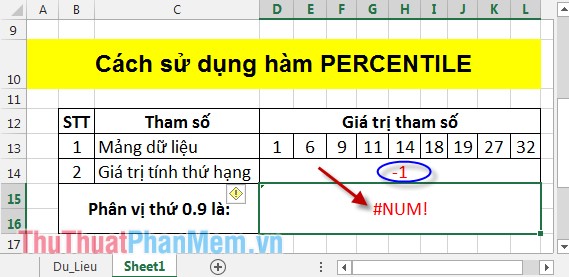
The percentile value is less than 0 error:
Above is the way to use PERCENTILE function , you pay attention to the use and problem of entering percentile values in the limit of 0 and 1.
Good luck!
You should read it
- QUARTILE.EXC function - The function returns the quartile of a dataset without values 0 and 1 in Excel
- QUARTILE.INC function - The function returns the quartile of a dataset including values 0 and 1 in Excel
- How to use the IF function in Excel
- How to use the IFS function in Excel 2016
- CHISQ.TEST function - The function returns the independence test in Excel
- OR function in Excel, how to use the OR function, and examples
- FORECAST function - The function returns a value along a linear trend in Excel
- GAMMA function - The function returns the gamma function value in Excel
May be interested
- PERCENTRANK function - The function returns the rank of the value in Excelin sorting and statistical data, you often have to rank the objects according to a certain criteria. the following article details how to use the percentrank function to find the rank of the value.
- POISSON function - The function returns the Poisson distribution in Excelin predicting the number of events that occur within a specific time, one cannot help but use the poisson function. the following article details how to use the poisson function, the function returns the poisson distribution.
- STDEV function - The function of estimating standard deviations based on a sample in Excelin the statistical probability of determining the corresponding deviation between samples is very meticulous and detailed, there is still some confusion. the following article details the stdev function that helps you estimate the standard deviation based on an existing sample.
- AMORDEGRC function - The function returns the depreciation for each accounting period in Excelexcel is a powerful tool in financial accounting. in each accounting period depreciation values are always mentioned. the following article details the amordegrc function, the function returns the depreciation for each accounting period.
- STDEVP function - The function of calculating standard deviations in Excelthe following article details how to use the stdevp function in excel, which helps you calculate standard deviations based on patterns.
- TDIST function - The function returns the probability of the Student distribution in Excelin probability statistics, calculating probability is a regular job and puts a lot of pressure on you. the following article introduces the tdist function in detail to help you calculate the probability value of the student distribution.