Z.TEST function - The function returns one-sided value of the z test in Excel
Z.TEST: The function returns the one-sided P value of the z test. Support functions from Excel 2010 onwards. Syntax: Z.TEST (array, x, [sigma])
The following article introduces you to the Z.TEST function - one of the functions in the statistical function group is very popular in Excel.

Description: The function returns one-sided P value of the z test. Support functions from Excel 2010 onwards.
Syntax: Z.TEST (array, x, [sigma])
Inside:
- array: An array or range of data to test for x, which is a required parameter.
- x: Value to check, is the required parameter.
- sigma: The overall standard deviation, which is an optional value, if omitted the sample standard deviation to be used.
Attention:
- If array is empty -> the function returns the # N / A error value
- When sigma is omitted -> Z.TEST is calculated by the formula:
Z.TEST (array, x, sigma) = 1- Norm.S.Dist ((Average (array) - x) / (sigma / √n), TRUE)
- Where sigma is not ignored -> Z.TEST function is calculated by the formula:
Z.TEST (array, x) = 1- Norm.S.Dist ((Average (array) - x) / (STDEV (array) / √n), TRUE)
Inside:
+ x is the sample mean AVERAGE (array)
+ n is COUNT (array).
- Z.TEST shows that when the base overall average is μ0 -> the probability of sample mean will be greater than the observed value of AVERAGE (array).
- You can use the following formula to calculate the probability of 2 sides:
= 2 * MIN (Z.TEST (array, x, sigma), 1 - Z.TEST (array, x, sigma)).
For example:
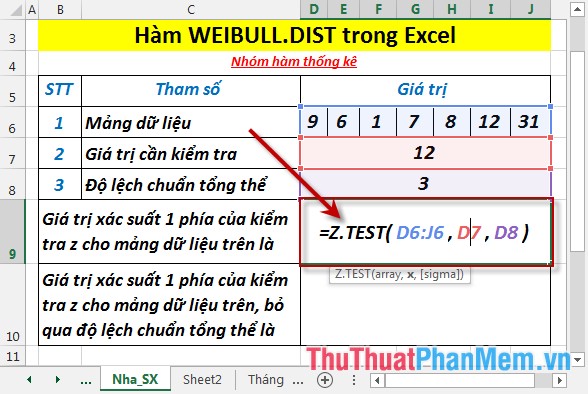
Calculate the 1-sided probability of z-tests as described in the following data table:

- Calculate the 1-sided probability value of the z-test for the dataset above. In a cell to calculate, enter the formula : = Z.TEST (D6: J6, D7, D8)
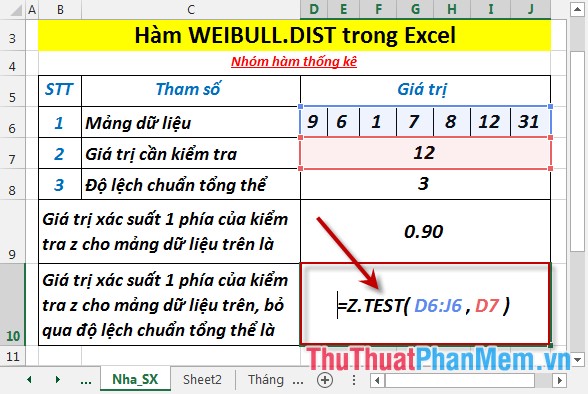
- Press Enter -> probability value 1 side of the z test for the above data set is:

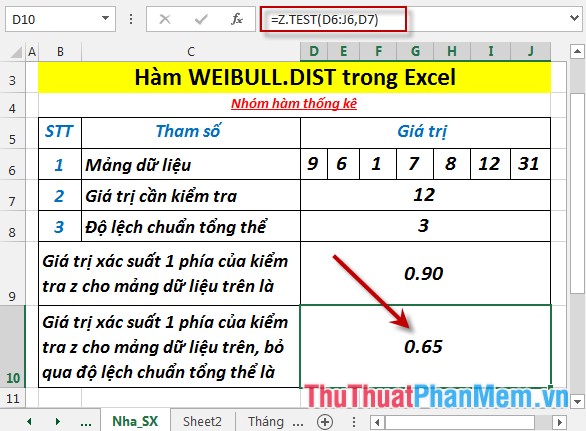
- Calculate the one-sided probability value of the z-test for the data set above, ignoring the overall standard deviation. In a cell to calculate enter the formula : = Z.TEST (D6: J6, D7)
- Press Enter -> probability value 1 side of the z test for the above data set, ignoring the overall standard deviation of:
Above are instructions and some specific examples when using the Z.TEST function in Excel.
Good luck!
Was this article helpful?
Your feedback helps us improve.
Related Articles
 ZTEST function - Returns the probability value on one side of the z test in Excel3 minutes read
 F.TEST function - The function returns the result of the F - test in Excel2 minutes read
 CHISQ.TEST function - The function returns the independence test in Excel3 minutes read
 TTEST - Returns the probability associated with a Student's t-Test in Excel3 minutes read
 T.INV.2T - The function returns the two-sided inverse of the Student's t-distribution in Excel3 minutes read
 T.TEST function - The function returns the probability associated with Student's t-Test in Excel3 minutes read
Reader Comments 0
Sign in with email or Google to join the discussion.