CHITEST function - The function returns the independence test in Excel
The following article details how to use CHITEST, the function returns independence test.
Description: The function returns the probability value from the χ2 distribution when squared for statistics. The function is applied to determine whether the hypothesis is executed or not.
Syntax: CHITEST (actual_range, expected_range) .
Inside:
- actual_range: The data range contains the values to be compared with the expected values, the required parameters.
- expected_range: The data range contains the ratio of the sum of the row and column totals to the total.
Attention:
- The χ2 test calculates the χ2 statistic calculated by the formula:

Inside:
+ Aij is the actual frequency in the i th row, j th column.
+ Eij is the expected frequency in the i th row, j th column.
+ r is the number of rows.
+ c is the number of columns.
- If actual_range and expected_range have different data points => the function returns the # N / A error value.
- The lower value of the independence, from the formula we see χ2 is always positive and only equals 0 if and only if Aij = Eij.
- CHITEST uses the distribution with degrees of degrees of freedom df. The method of calculating df values is as follows:
+ if r> 1 and c> 1 => df = (r-1) (c-1).
+ if r = 1 and c> 1 => df = (c-1).
+ if r> 1 and c = 1 => df = (r-1)
The value of r and c are not equal to 1, so there is no case for r = 1 and c = 1.
- The best CHITEST function should be applied in case the Eij values are not too small, the Eij should be greater than or equal to 5 to achieve the most accurate results.
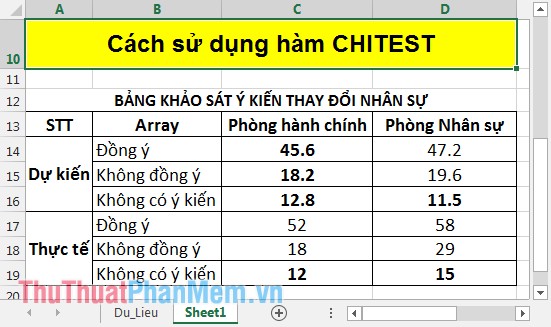
For example:

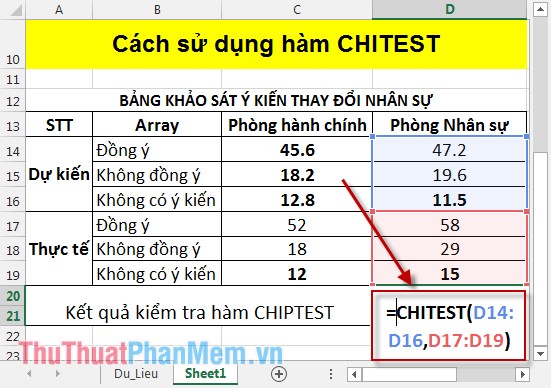
In the cell to calculate enter the formula: = CHITEST (D14: D16, D17: D19) .

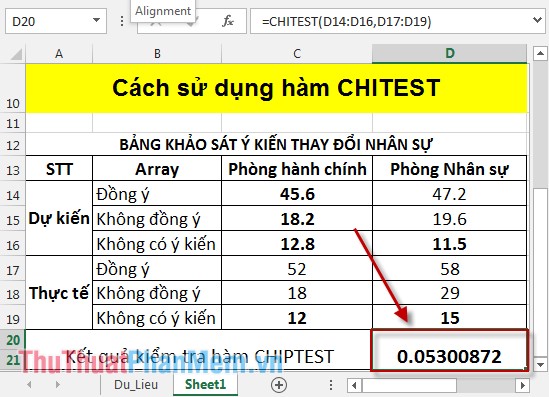
After entering the formula, press Enter to get the results:

Thus, the value CHIPTEST = 0.05300872 => The initial expectation is quite close to reality.
Above is a guide to using the CHIPTEST function, hoping to help you apply it a lot in your work.
Good luck!
You should read it
- ★ Z.TEST function - The function returns one-sided value of the z test in Excel
- ★ T.TEST function - The function returns the probability associated with Student's t-Test in Excel
- ★ FTEST function - The function returns the result of an F-Test in Excel
- ★ ZTEST function - Returns the probability value on one side of the z test in Excel
- ★ FISHER function - The function returns the Fissher transformation at x in Excel