How to use developer tools on web browsers
The instructions below show you how to access developer tools in some popular web browsers.
In addition to focusing on everyday users who want to surf the web, most browser makers also cater to both web developers, designers and quality assurance experts who help build applications. and the website the user is accessing, by integrating many powerful tools into the browser.
The days when the only testing and programming tools found in the browser, only allowing you to view the source code of the page, are over. Today's browsers allow you to go much deeper, by performing operations such as executing and debugging snippet JavaScript, checking and editing DOM elements, and monitoring real-time network traffic when load the application or page, to determine congestion status, analyze CSS performance, make sure your code doesn't use too much memory or CPU cycles, etc.
From an experimental perspective, you can replicate the way applications or websites display in browsers, as well as on many different devices and platforms, through the magic of responsive design (responsive. ) and integrated emulator. The best part is that you can do all of this without leaving your browser!
The instructions below show you how to access developer tools in some popular web browsers.
Do you know how to access developer tools on these web browsers?
- Google Chrome
- Mozilla Firefox
- Microsoft Edge / Internet Explorer
- Apple Safari (OS X only)
Google Chrome
Chrome's developer tools allow you to edit and debug code, test individual components to find all performance issues, simulate different device screens including both applications running Android or iOS, as well as perform some other useful functions.
1. Choose Chrome's main menu, marked with three horizontal lines and located in the upper right corner of the browser.
2. When the drop-down menu appears, hover your mouse over the More tools option .

3. A submenu will appear. Select the option with the Developer tools label . You can also use the following shortcut instead of this menu item: Chrome OS / Windows ( CTRL + SHIFT + I ), Mac OS X ( ALT / OPTION ) + COMMAND + I ).
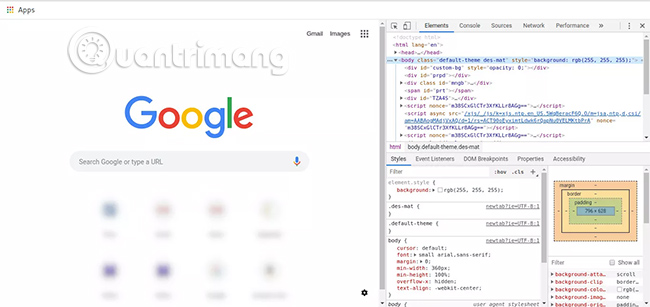
4. The Chrome Developer Tools interface will be displayed, as shown in the screenshot below. Depending on the version of Chrome you are using, the initial layout you see may be slightly different from the version shown here. The main center of developer tools, usually at the bottom or right of the screen, contains the following tabs.
- Elements: Provides the ability to test CSS and HTML code as well as quick CSS editing, see the impact of changes you make in real time.
- Console: Chrome's JavaScript control panel allows direct input as well as diagnostic debugging.
- Sources: Allows you to debug JavaScript code through a powerful graphical interface.
- Network: Sort and display detailed information about each related operation on the active application or page, including completing response and request headers as well as advanced time data.
- Performance: Check website performance by monitoring load time. You can also simulate different cases, like the ability of mobile CPU.
5. In addition to these sections, you can also access the following tools via the >> icon, located to the right of the Performance tab .
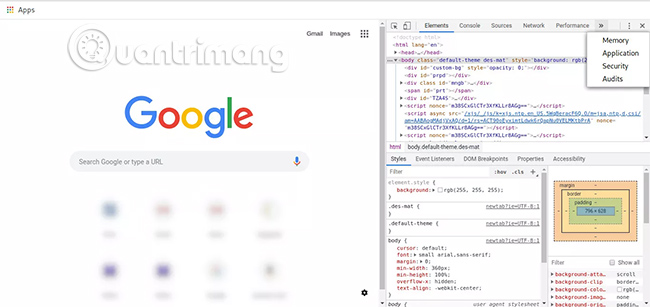
- Memory: Track and record memory usage on a web page. You can see the 'weight' of JavaScript on your website.
- Security: Highlight certificate issues and security-related problems other than the active page or application.
- Application: Checks the resources being used by a web application. Get a complete, detailed report of what is being used.
- Audits: Provides ways to optimize the page or application load time and overall performance.
6. Device Mode allows you to view the activity page in the emulator, displaying nearly exactly the same as when it appeared on one of dozens of devices, including some famous Android and iOS models like the iPad , iPhone and Samsung Galaxy. You are also provided with the ability to simulate custom screen resolutions to suit your specific development or testing needs.
To turn on and turn off Device Mode, select the mobile phone icon to the left of the Elements tab .

7. You can also customize the look of the developer tools, by first selecting the menu button indicated by three vertical dots, located on the right side of the aforementioned tabs. .

From within this drop-down menu, you can reposition the dock, show or hide different tools, and launch more advanced items, such as device inspectors. You will find that the very interface of the developer tool is also highly customizable through the settings found in this section.
Mozilla Firefox
Firefox's Web Developer section includes tools for designers, developers, and testers, such as style editors and target eyedropper for pixels.
1. Select Firefox's main menu, denoted by three horizontal lines and located in the upper right corner of the browser window.
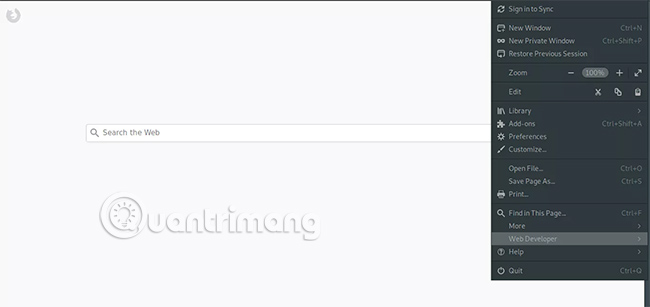
2. When the drop-down menu appears, select Web Developer. The Web Developer menu will now be displayed, containing the following options. You will notice that most menu items have shortcuts related to them.

- Toggle Tools: Show or hide the developer tool interface, usually located at the bottom of the browser window. Keyboard shortcuts: Mac OS X (
ALT/OPTION+COMMAND+I), Windows (CTRL+SHIFT+I) - Inspector: Allows you to check and / or adjust CSS and HTML code on the page as well as on mobile devices, via remote debugging. Keyboard shortcuts: Mac OS X (
ALT/OPTION+COMMAND+C), Windows (CTRL+SHIFT+C). - Web Console: Allows you to execute JavaScript expressions in the active page, as well as review a diverse set of recorded data, including security alerts, network requests, CSS notifications, etc. . Keyboard shortcuts: (
ALT/OPTION+COMMAND+K), Windows (CTRL+SHIFT+K) - Debugger: The JavaScript debugger allows you to identify and correct errors by setting breakpoints, checking DOM nodes, black box external sources, etc. As in the case of Inspector, this feature also supports Remote debugging. Keyboard shortcuts: Mac OS X (
ALT/OPTION+COMMAND+S), Windows (CTRL+SHIFT+S). - S tyle Edito r: Allows you to create new stylesheets and combine them with an active website, or edit existing tables and check how changes have been made to display in the browser with just one click. Keyboard shortcuts: Mac OS X, Windows (
SHIFT+F7). - Performance: Provides a detailed analysis of the active page network performance, frame rate data, JavaScript execution time and status, etc. Keyboard shortcuts: Mac OS X, Windows (
SHIFT+F5). - Network: Lists each network request initiated by the browser along with the corresponding method, the root domain, type, size and duration have passed. Keyboard shortcuts: Mac OS X (
ALT/OPTION+COMMAND+Q), Windows (CTRL+SHIFT+Q). - Storage Inspector: See the cache and cookies stored by a website. Shortcut on keyboard:
SHIFT+F9. - Developer Toolbar: Open the interactive command line interpreter. Enter help in the interpreter to get a list of all available commands and their appropriate syntax. Keyboard shortcuts: Mac OS X, Windows (
SHIFT+F2). - WebIDE: Provides the ability to create and execute web applications through an actual device running Firefox OS or Firefox OS Simulator (Firefox operating system emulator). Keyboard shortcuts: Mac OS X, Windows (
SHIFT+F8). - Browser Console: Provides the same functionality as the Web Console (see above). However, all data returned is for the entire Firefox application (including browser-level extensions and functions), not just the active site. Keyboard shortcuts: Mac OS X (
SHIFT+COMMAND+J), Windows (CTRL+SHIFT+J). - Responsive Design View : Allows you to view a web page right at different resolutions, layouts and screen sizes, mimicking many devices, including tablets and smartphones. Shortcut: Mac OS X (
ALT/OPTION+COMMAND+M), Windows (CTRL+SHIFT+M). - Eyedropper: Displays hex color code for individual selected pixels. Scratchpad: Allows you to write, edit, integrate and execute snippet JavaScript from within the Firefox window that appears.
- Scratchpad: Open an interactive JavaScript document that allows you to write code and test it with a web page. Keyboard shortcuts:
Shift+F4. - Service Workers: Debugging Service Worker (the script that the browser runs in the background, separating from the site, performing features that do not need a website or user interaction) for your web application. Get detailed information about their performance and errors.
- Page Source: Original browser-based developer tool. This option simply displays the source code available for the active page. Keyboard shortcuts: Mac OS X (
COMMAND+U), Windows (CTRL+U). - Get More Tools : Open Web Developer 's Toolbox collection on Mozilla's official add-on page, which includes about a dozen popular extensions like Firebug and Greasemonkey.
Microsoft Edge / Internet Explorer
Often referred to as the F12 Developer Tools , a reverence for shortcuts that launch the interface since previous versions of Internet Explorer, the developer toolkit in IE11 and Microsoft Edge has come a long way. Since its inception, by providing a very handy set of trackers, debuggers, emulators and compilers.
1. Select More actions , indicated by three dots and in the upper right corner of the browser window. When the drop-down menu appears, select the option labeled Developer Tools .
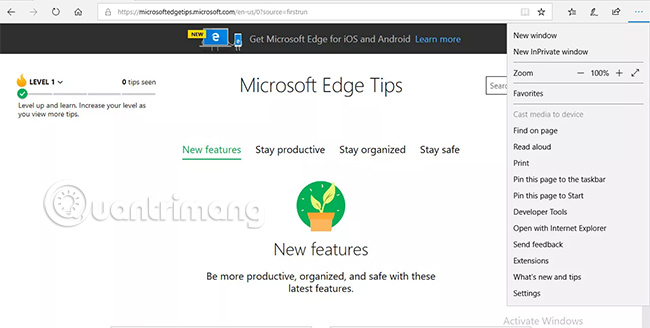
2. The development interface will be displayed, usually at the bottom of the browser window. The following tools are available, each tool is accessible by clicking on the corresponding tab title or using the included shortcut.
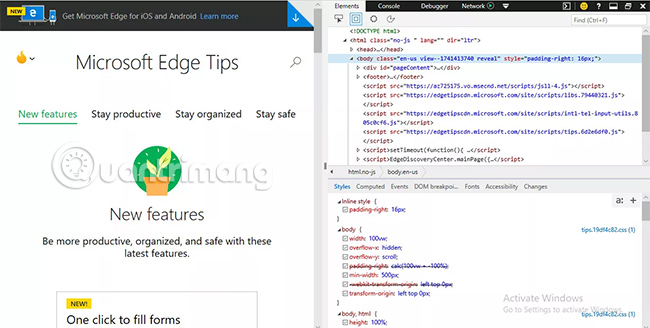
- DOM Explorer : Allows you to edit the stylesheet and HTML in the active page, rendering modified results. Use IntelliSense to automatically complete code where applicable. Shortcut:
CTRL+1. - Console: Provides the ability to submit debugging information including counters, timers and custom notifications via the integrated API. In addition, allows you to add code to an active website and modify the values assigned to individual variables in real time. Shortcut on keyboard:
CTRL+2. - Debugger: Allows you to set breakpoints and debug your code while it's executing, line by line if necessary. Keyboard shortcut:
CTRL+3. - Network: List each network request initiated by the browser during the page load, including protocol details, content type, bandwidth usage, etc. Shortcut:
CTRL+4. - Performance: Detailed frame rates, CPU usage and other performance-related metrics, help you speed up page load times and other operations. Shortcut:
CTRL+5. - Memory: Helps you isolate and fix potential memory leaks on the current web page, by displaying the timeline using memory along with snapshots from different time periods. Shortcut:
CTRL+6. - Emulation: Shows you how the active page will display in different screen resolutions and sizes, simulating smartphones, tablets and many other devices. Provides the ability to modify user agents and page orientation, as well as simulate different geographical locations by entering latitude and longitude. Keyboard shortcut:
CTRL+7.
3. To display the Console while inside any other tool, press the square button with the right bracket inside it, located in the upper right corner of the development tool interface.

4. To unlock the developer tool interface, turn it into a separate window, select the two-tiered rectangle icon or use the following shortcut: CTRL + P You can put the tools back to their original position by pressing CTRL + P for the second time.
Apple Safari (OS X only)
Safari's diverse development toolset reflects a large developer community, using Macs for their design and programming needs. In addition to the powerful control panel, as well as traditional logging and debugging features, the responsive, easy-to-use design mode and your own browser extension tool are also provided.
1. Select Safari in the browser menu, located at the top of your screen. When the drop-down menu appears, select Preferences. You can also use the following shortcut instead of this menu item: COMMAND + Comma ( , ).
2. Safari's Preferences interface will now be displayed, located on your browser window. Select the Advanced icon , located on the right side of the title.
3. Advanced options will be displayed. At the bottom of this screen is an option labeled Show Develop menu in the menu bar, accompanied by a checkbox. If there is no checkmark displayed in the box, click the option once to select it.
4. Close the Preferences interface by clicking on the red X found in the upper left corner.
5. You should now see a new option in the browser menu called Develop, located between Bookmarks and Window. Click this menu item. A drop-down menu will be displayed, containing the following options.
- Open Page With : Allows you to open an active website in one of the other browsers currently installed on your Mac.
- User Agent : Allows you to choose from many predefined user agent values, including some versions of Chrome, Firefox and Internet Explorer, as well as define your own custom string.
- Enter Responsive Design Mode : Render the current page as it will appear on many devices and in different screen resolutions.
- Show Web Inspector : The main interface launch for Safari's development tools, usually located at the bottom of the browser screen and contains the following sections: Elements, Network, Resources, Timelines, Debugger, Storage, Console .
- Show Error Console : Also launch the development tool interface directly to the Console tab , which displays errors, warnings and other searchable log data.
- Show Page Source : Open the Resources tab , display the source code for the active page, sorted by document.
- Show Page Resources : Perform the same function as Show Page Source .
- Show Snippet Editor : Open a new window where you can enter CSS and HTML code, preview its output quickly.
- Show Extension Builder : Provides the ability to create or edit Safari extensions with CSS, HTML and JavaScript.
- Show Timeline Recording : Open the Timelines tab and start displaying network requests, layouts and rendering information as well as implementing JavaScript in real time.
- Empty Caches : Clear all cache currently stored on the hard drive.
- Disable Caches : Stop Safari from logging to cache so that all content is retrieved from the server after each page load.
- Disable Images : Prevent rendered images on all websites.
- Disable Styles : Ignore CSS properties when a page is loaded.
- Disable JavaScript : Restrict JavaScript execution on all pages.
- Disable Extensions : Prohibits all installed extensions from running in the browser.
- Disable Site-specific Hacks : If Safari has been modified to handle specific problem (s) for the active site, this option will block those changes to load as before the modifications were made. given.
- Disable Local File Restrictions : Allows the browser to access files on your local drive, an action that is restricted by default for security reasons.
- Disable Cross-Origin Restrictions : These restrictions are set by default to prevent XSS and other potential risks. However, they often need to be temporarily disabled for development purposes.
- Allow JavaScript from Smart Search Field : When enabled, users are provided the ability to enter URLs using javascript: integrated directly into the address bar.
- Treat SHA-1 Certificates as Insecure : SSL certificates using SHA-1 algorithms are considered obsolete and vulnerable to attack.
Discover more
web browser developer toolsShare by
Micah SotoYou should read it
- If you are a Web Developer, don't miss out on these 67 useful tools, libraries and resources!
- How to add the Developer tab to the Ribbon in Microsoft Word
- What is Developer Mode on Windows 10? How to activate this mode?
- How to become a good software developer?
- Learn Firefox versions: Firefox Quantum, Nightly, Beta, Developer, Extended Support Release
- The Quiet Details That Make a Sports Betting Platform Feel Reliable
- Instructions on creating toy set images with ChatGPT AI
- How are AI agents changing the journalism industry?
- How to bring the new Twitter interface to the old version
- Fall out with situations where condom use is still pregnant
- What industrial floor scrubber should be purchased to clean the factory, company office?