Table of Contents
Web Developer Tools Firefox: Learn About Firefox's Web Developer is easier to understand when the core ideas are paired with practical examples. The sections below explain the topic clearly, highlight useful steps, and point out details that can prevent common errors.
TipsMake.com - In the following article, we will introduce and guide you how to exploit and use the supported Web Developer toolkit available in Firefox. This component includes an application for analyzing, checking websites, implementing any kind of JavaScript code, requests and messages via HTTP. Recently, Mozilla has integrated the Inspector tool and updated Scratchpad in Firefox 10 version. This combination has made 'fire fox' one of the few ideal browsers for online application developers and web developers.
Page Inspector:
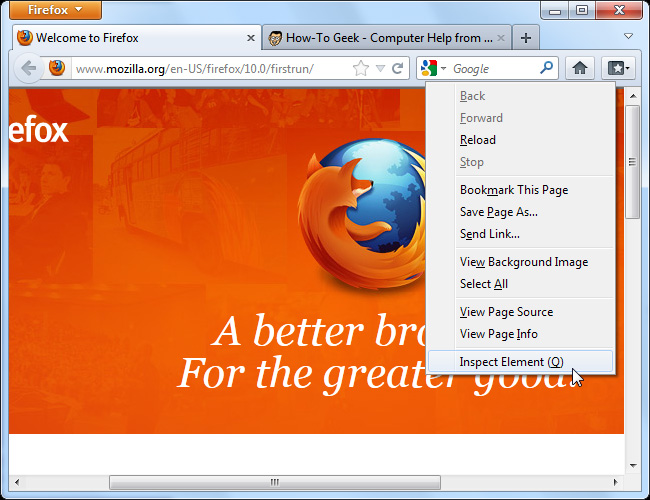
Check specific sections on any web page by selecting that area, right-clicking and selecting Inspect (press Q ), or you can start Inspector directly from the Web Developer menu:
You will see a toolbar displayed at the bottom of the screen used in the Inspector control. When selecting certain components, all the rest will be blurred:
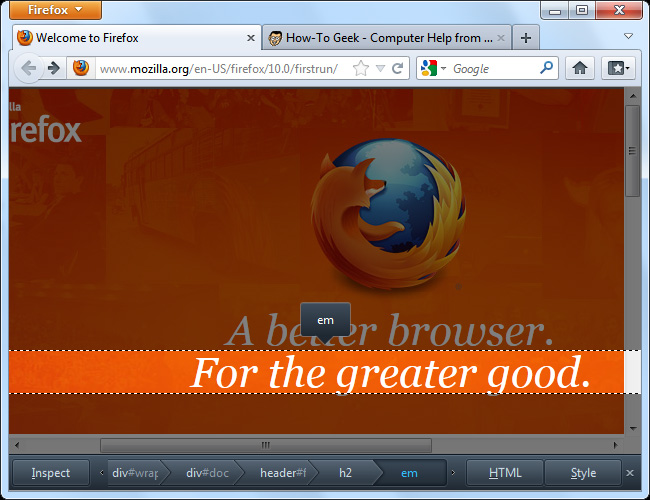
If you want to select a new detail, click the Inspect button on the toolbar, move the cursor, select a new element and Firefox will highlight it immediately below the mouse position:

Besides, the simple and appropriate layout of Inspector also helps us easily distinguish different parent and child objects.
HTML Inspector:
Click the HTML button to display the currently selected HTML code:

Here, we can expand or shrink HTML tags. If you want to see the entire code in a simple way, select View Page Source from the Web Developer menu .

CSS Inspector:
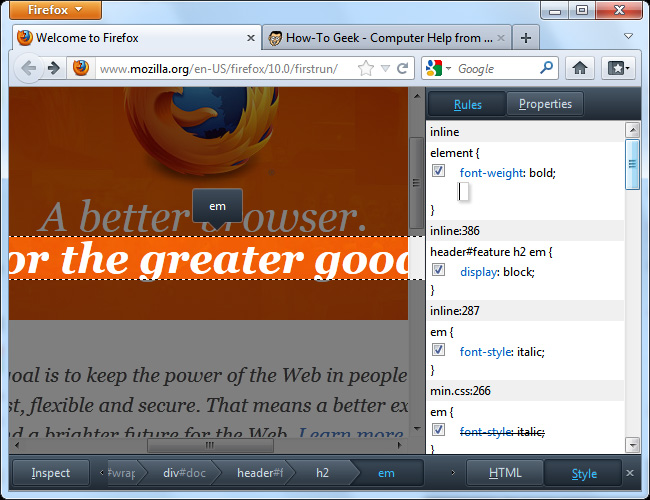
Click the Style button to display the CSS formatting being applied on the selected part.
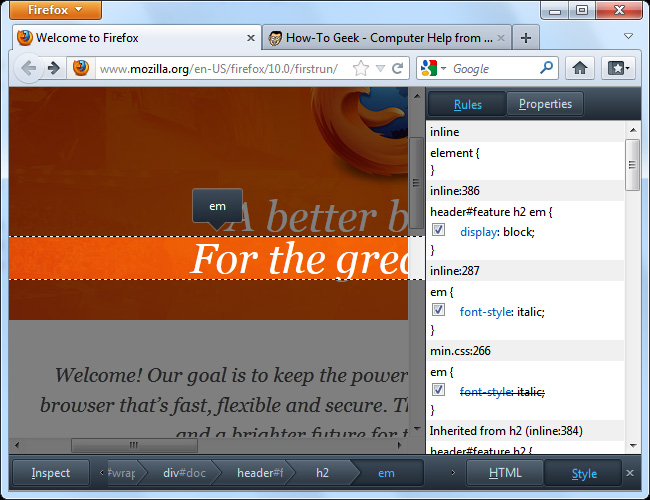
There is also a CSS properties panel, users can switch between them by clicking the Rules button or Properties , if you want to search for information quickly, enter the corresponding data in the Search box.
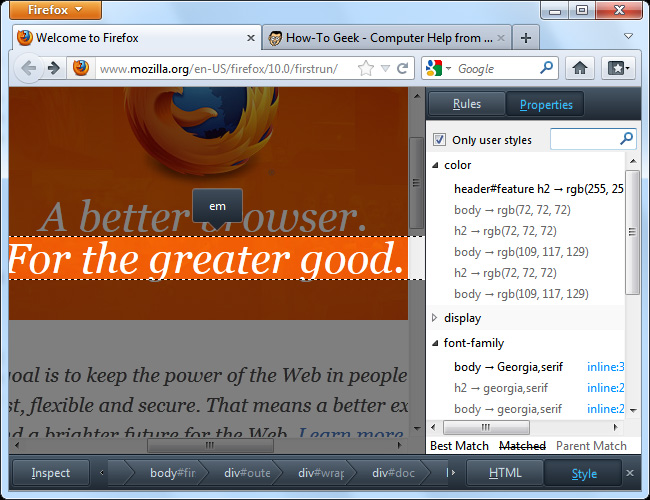
Or directly edit CSS quickly and easily from the Rules panel, uncheck any box to turn off the rule, click the corresponding link to change the rule, manually assign a new Rule. object from the top panel. For instance,, here we have added the CSS font-weight: bold attribute ; to make the text bold.
JavaScript Scratchpad:
The new Scratchpad feature has been integrated into Firefox 10 by Mozilla developers, and now comes with the ability to mark the necessary syntax and commands.

After selecting a certain piece of code, select Execute> Run menu, and the selected code will run directly on the open tab.
Web Console:
In fact, this is an alternative to the Error Console section on older browser versions - which will be quickly removed in new Firefox versions.
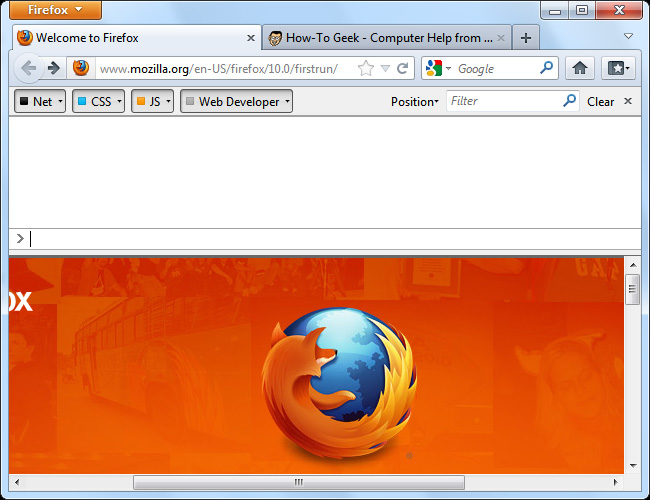
The main console section displays four different types of notifications:
- Requests, signals sent in the network.
- JavaScript error message.
- CSS error message.
- Notice from the Web Developer section.
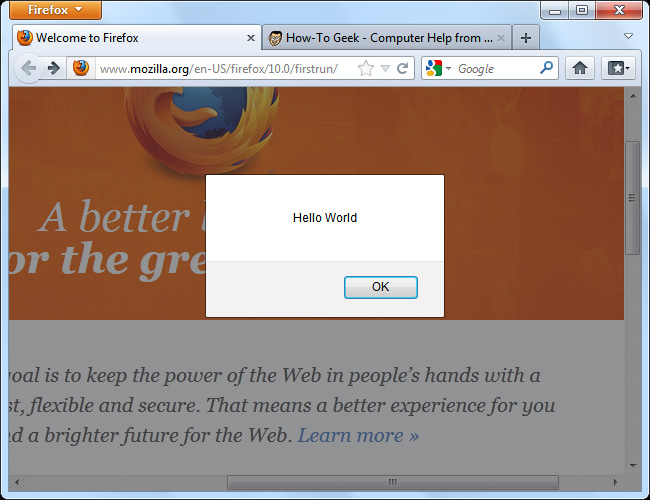
So what is the notification from Web Developer? These are simply messages displayed from the window.console object. For instance,, we can run the JavaScript code window.console.log ('Hello World'); directly in Scratchpad to print this message to Console . Besides, web developers can integrate this function with JavaScript to improve debugging ability.

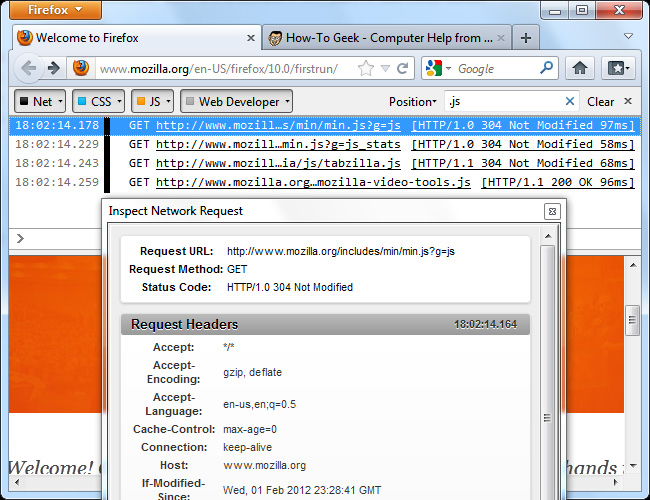
Refresh the current page, and we will see the network requirements created by the system as well as many other notifications.
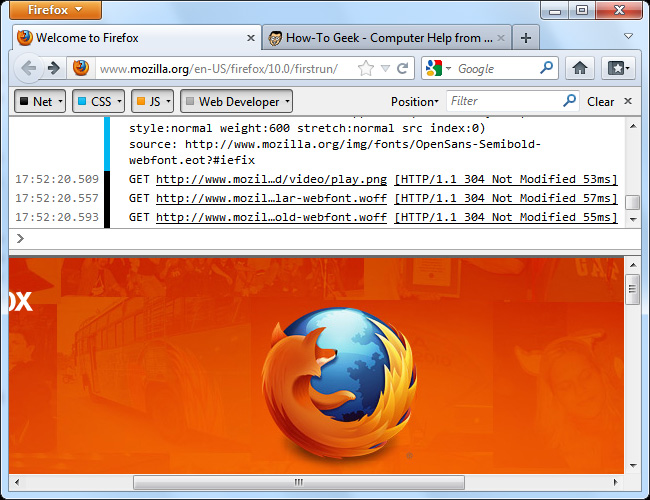
Use the Search box to filter data, click on a request to display details, specifically:
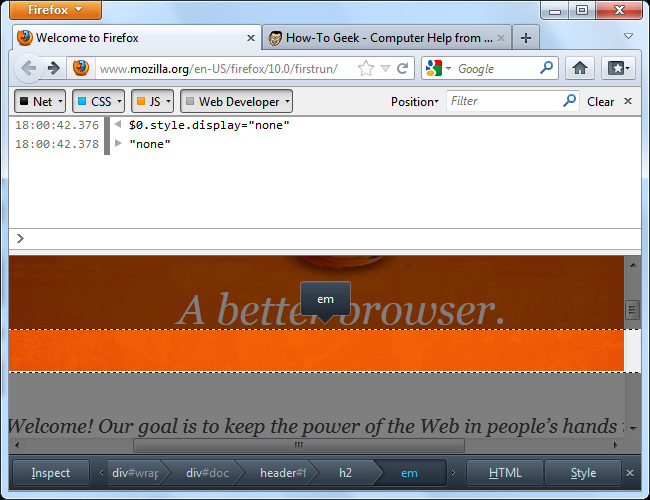
In Firefox 10, the Web Console can work in tandem with the Page Inspector. The parameter $ 0 is the selected object in the Inspector table. Therefore, if you want to hide any object, just select and run the command $ 0.style.display = 'none' in the Console section.
If you want to learn more about how to use the Console and its associated functions, please go to the official Developer Network website of Mozilla.
Get More Tools:
In addition, the Get More Tools option will switch to Web Developer 's add on Toolbox on the Mozilla Add-Ons website system, including a lot of utilities for programmers, web application developers, some applications Support like Firebug or Web Developer Toolbar.
FAQ
What should you know about page Inspector?
Check specific sections on any web page by selecting that area, right-clicking and selecting Inspect (press Q ), or you can start Inspector directly from the Web Developer menu:
What should you know about hTML Inspector?
Click the HTML button to display the currently selected HTML code:
What should you know about cSS Inspector?
Click the Style button to display the CSS formatting being applied on the selected part.
Related Articles
 How to Use Developer Tools on Web Browsers17 minutes read
 If You Are a Web Developer, Don't Miss Out on These 67 Useful5 minutes read
 How to Become an Android Application Developer?10 minutes read
 Mozilla Officially Released Firefox Developer Edition6 minutes read
 How to Add the Developer Tab to the Ribbon in Microsoft Word5 minutes read
 What Is Developer Mode on Windows 10? How to Activate This Mode?4 minutes read
Reader Comments 0
Sign in with email or Google to join the discussion.