Table of Contents
This guide explains how to show Windows 10's Hidden Floating Performance Panel, with clear steps, practical tips, and important checks before you begin.
There are two ways to do this: You can either use Task Manager or overlay the Xbox Game Bar. Both tools have some easy-to-miss performance panels that can be detached from the tool itself and will appear as a small floating overlay, always on top of other running apps. The article will show you both methods here.
Activate the Performance window of the Task Manager
Windows 10's Task Manager comes with performance stats that have been added from within Windows 8. You can separate these statistics from the Task Manager window.
To find them, open Task Manager by pressing Windows + Shift + Esc or right-clicking on the taskbar and selecting Task Manager.
Click Options> Always on Top if you want the overlay window to always appear on top of your other application windows.

Click the Performance tab at the top of the window. If you don't see it, first click More Details at the bottom.
Select the performance chart you want to see in the sidebar. You'll see options for your computer's CPU, memory, storage devices (including SSDs, hard drives, and USB devices), network connectivity (wired Ethernet and Wi-Fi), GPU (graphics processor ).
To show only one performance chart, double-click anywhere on the chart in the right panel. You can also right-click on the chart and choose Graph Summary View .

You can resize the window to make the window smaller, and you can also click and drag anywhere inside it to position it where you want on the screen.
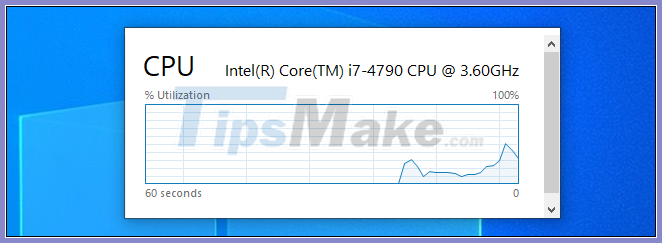 Position the chart as you like
To re-maximize the Task Manager window, simply double-click inside it or right-click and deselect Graph Summary View .
If you want to change to a different graph - for example, to change from CPU to GPU usage statistics - double click on the chart window, select another graph in the sidebar and double click on chart one Again.
By the way, you can also double-click anywhere on the left panel to see it in a smaller floating window. It's a great way to keep track of multiple resource stats at the same time.
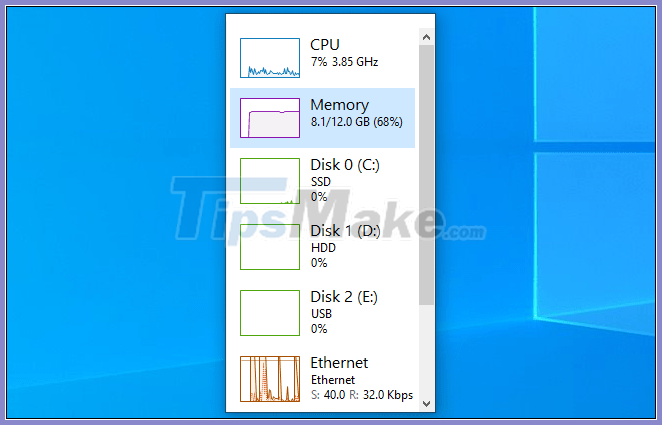 View control panel in smaller window
Pin the Game Bar's performance panel to the screen
Windows 10 Game Bar is an integrated overlay with all sorts of tools useful for gamers (and non-gamers), including performance graphs. This floating window is commonly found in the main Game Bar overlay. However, you can 'pin' it to your desktop and have it appear in all other windows - desktop applications and PC games are the same.
To find it, open the Xbox Game Bar overlay by pressing Windows + G .
If the Game Bar doesn't appear, go to Settings> Gaming> Xbox Game Bar . Make sure Game Bar is enabled and check its keyboard shortcut here. You may have disabled the Game Bar or previously selected a custom shortcut to open it.
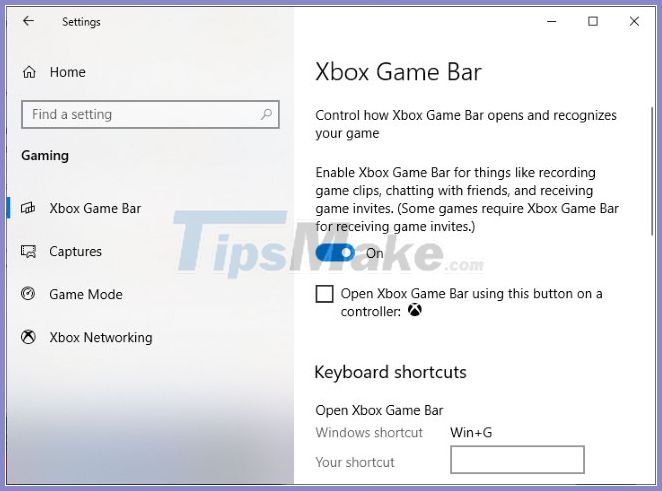 Make sure Game Bar is enabled
Find the Performance window, near the bottom left corner of the Game Bar overlay screen by default. If you don't see it, click the Performance button on the Game Bar menu at the top of the screen to display it.
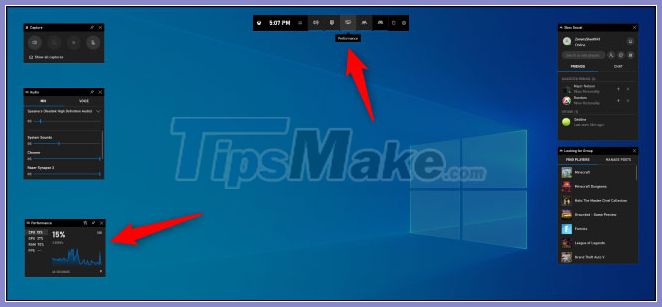
Click the Pin button above the small Performance window.
Now, it will appear even if you close the Game Bar interface. Click anywhere in the background of the overlay or press Windows + G again to close the Xbox Game Bar overlay.
You can hover over the Performance window and click the arrow to maximize the window (show the graph) or minimize it (show resource usage statistics on the side of the window only).
You can also click an option on the left side - CPU, GPU, RAM or FPS - to bring up that graph. To start viewing FPS stats, click on the FPS option and follow the instructions in the window. You will be asked to click the Request Access button and then restart your PC.
To further customize, open the Game Bar interface by pressing Windows + G . Here, you can drag the title bar of the window to position it on the screen. You can only move the floating window from the Game Bar overlay.
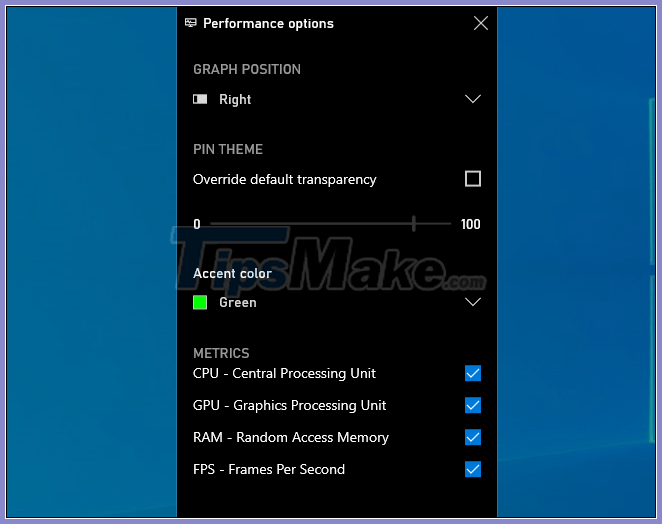
You can also click the Performance Options settings button at the top of the Performance window in the overlay to get more settings. It is located to the left of the Pin button .
Here, you can control the accent color (green by default), make the overlay with a transparent background, choose which metrics (CPU, GPU, RAM and FPS) are displayed, and choose which side of the door window in which the chart appears.
If you're displaying performance graphs above a full-screen game, you may want to enable transparency for better integration into your game interface.
To hide the window, reopen the Game Bar interface ( Windows + G ) and click the pin icon on the Performance window . It will be unpinned and will only show up when you open the Game Bar interface.
FAQ
What should I know about Show Windows 10's Hidden Floating Performance Panel?
Focus on the key features, requirements, limitations, and practical use cases explained in this guide.
How do I get the best results with Show Windows 10's Hidden Floating Performance Panel?
Follow the recommended steps, use current software or information, confirm compatibility, and review settings before major changes.
Are there any risks or limitations?
Potential limitations depend on compatibility, data quality, cost, privacy, support, and how the product or method is used.
Related Articles
 Control Panel Will Soon Disappear on Windows 103 minutes read
 How to Show Hidden Files and Folders on Windows 10/8/74 minutes read
 Instructions to Disable Control Panel on Windows 74 minutes read
 How to Show or Hide Files in Windows 73 minutes read
 How to Show Hidden Files on Windows 11: Practical Guide6 minutes read
 How to Access Control Panel on Windows 10, How to Access Control Panel on3 minutes read
Reader Comments 0
Sign in with email or Google to join the discussion.