How to Develop an Irrigation Schedule Using Cropwat 8.0
Part 1 of 7:
Familiarizing yourself with the software
-
 Download and install the software. Download CropWat 8.0 from FAO website and then install it. This program runs on the following Windows platforms: 95/98/ME/2000/NT/XP/7 and Vista.
- To get the software, visit http://www.fao.org/nr/water/infores_databases_cropwat.html.
-
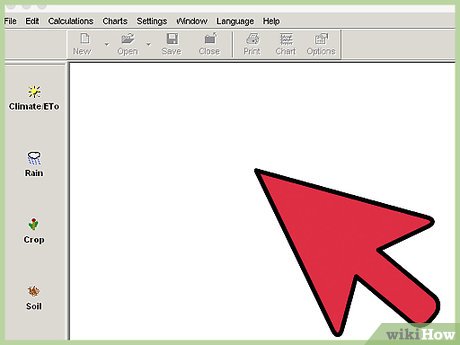
 Get familiar with the user interface. CropWat 8.0 has a user-friendly interface that includes the following features:
- Using the 'File' menu, you can start a new session, open an existing session, save a session, close a session, open new input file (climate/ETo, Rain, crop, soil and cropping pattern), save an input or output file, print and exit.
- From the 'Edit' menu you can do basic cut, copy and paste operations.
- From the 'Calculations' menu you can calculate water requirements, develop a schedule and calculate scheme supply.
- The buttons on the left side panel can also be used to create input files or perform calculations.
- Using the 'Charts' menu, you can create charts or graphs.
- Using the 'Settings' menu, you can change the options of input and output files and change file locations.
- From the 'Language' menu, you can change the interface to either English, French, Russian or Spanish languages.
Part 2 of 7:
Inputting and collating climate data
-
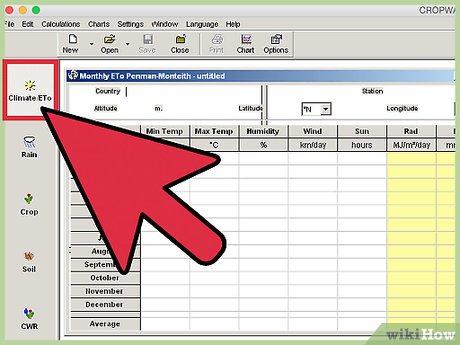
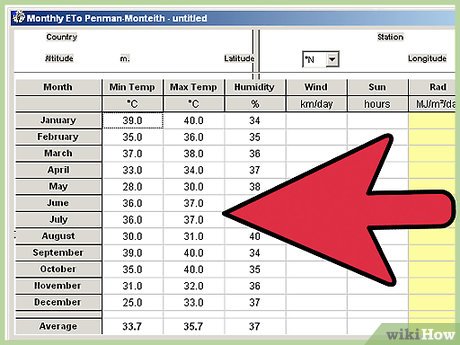
 Collect and input climate data. Click on the 'Climate/ETo' button on the left side panel to input the collected climate data. CropWat uses daily, decade or monthly climate data to estimate reference evapotranspiration (ETo).
- If you want to calculate irrigation water requirements for any previous year, then you need to collect the climate data for that year from your nearest meteorological station.
- If you want to calculate irrigation water requirements for any future time then you need to collect future forecast data.
- If local climatic data are not available, you can obtain those data for over 5,000 stations worldwide from CLIMWAT (an associated climatic database).
-
 Get the appropriate data. CropWat requires the following climate data:
- maximum and minimum temperature (°C) or average temperature (°C),
- relative humidity (%) or vapour pressure (kPa),
- wind speed (km/day or m/s),
- sunshine hour or percent of day length or fraction of day length.
Part 3 of 7:
Inputting and collating rainfall data
-
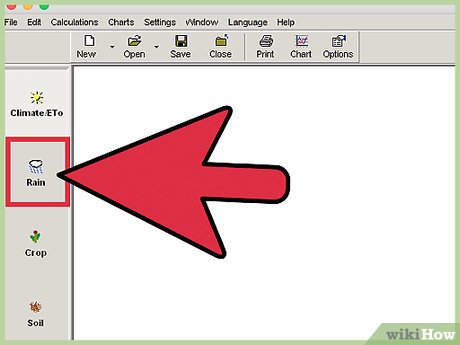
 Collect and input rainfall data. Collect the rainfall data. Click on the 'Rain' button to input the collected rainfall data.
 -
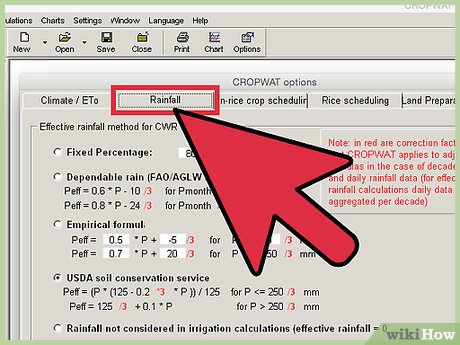
 From the 'Settings' menu open the 'Options' and click on 'Rainfall' tab to select the method of calculating effective rainfall. The available options for calculating effective rainfall are:
- fixed percentage,
- dependable rainfall (FAO/AGLW formula),
- empirical formula, and
- USDA soil conservation service method.
Part 4 of 7:
Inputting and collating crop data
-
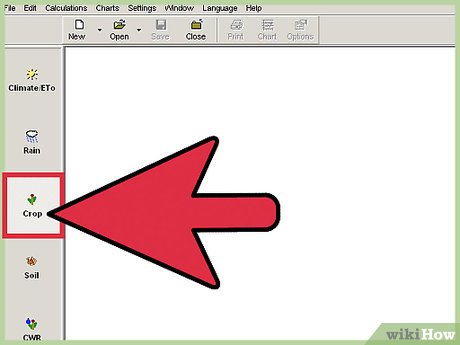
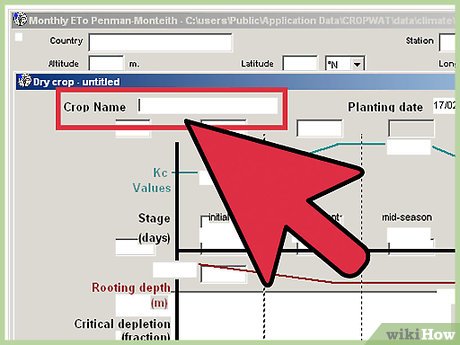
 Collect and input crop data. Collect the required crop data. Click on the 'Crop' button on the left side panel to input the crop data. CropWat is suitable to estimate irrigation water requirements for both dry crops and rice.
 -
 Collect the following crop data for dry crops:
- planting date,
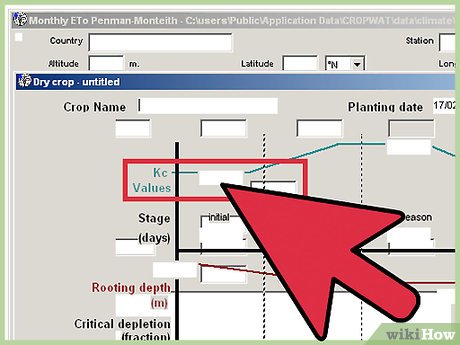
- Kc values at initial, mid-season and at harvest,
- number of days for initial, development, mid-season and late season,
- rooting depth (m),
- critical depletion (fraction) at initial, mid-season and late season,
- yield response factor at initial, development, mid-season and late season,
- crop height (m).
-
 Collect the following data for rice (you need to collect some additional data):
- both Kc dry and Kc wet values at every stage,
- number of days for nursery and land preparation also,
- puddling depth (m),
- nursery area (%).
Part 5 of 7:
Inputting and collating soil data
-
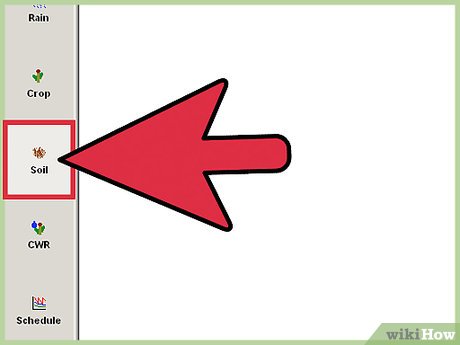
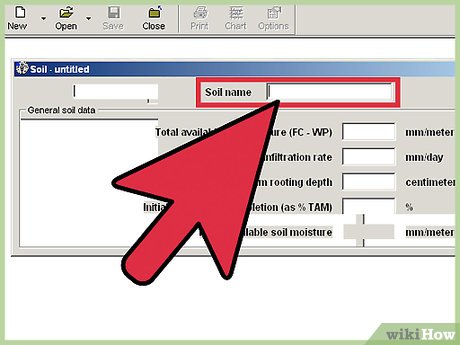
 Collect and input soil data. Collect the required soil data. Click on the 'Soil' button on the left side panel to input the soil data. CropWat requires the following soil data:
- total available soil moisture (mm/meter),
- maximum rain infiltration rate (mm/day),
- maximum rooting depth (cm),
- initial soil moisture depletion (as % TAM),
- initial available soil moisture (mm/meter).
-
 Provide additional soil data for rice:
- drainable porosity (%),
- critical depletion for puddle cracking (fraction),
- maximum percolation rate after puddling (mm/day),
- water availability at planting (mm WD or % desat. or % depl.),
- maximum water depth (mm).
Part 6 of 7:
Estimating your irrigation water needs
-
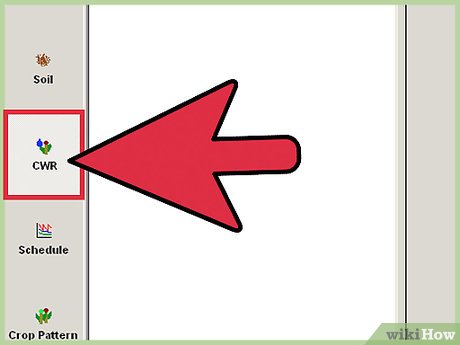
 Estimate your irrigation water requirements. After completing the previous steps, click on the 'CWR' button on the left side panel to estimate your own irrigation water requirements. Irrigation requirements are shown in mm/decade.
 -
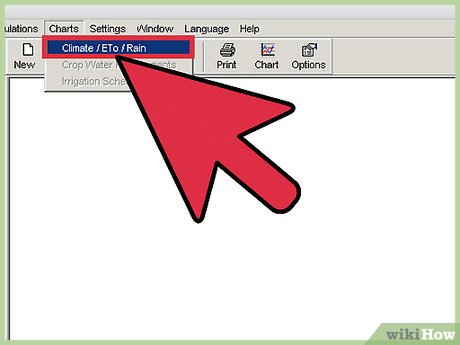
 Get a climate/ETo/rain chart. Click on the 'Charts' menu, then click on 'Climate/ETo/Rain' to get a chart of the inputted climate variables. Below the chart, you will see that there are options to select which variables you want to show on your chart. You can also select whether the variables will show as either a bar or a curve.
 -
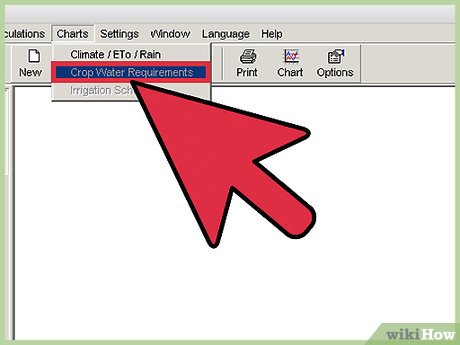
 Get a crop water requirements graph. Click on the 'Charts' menu, then click on 'Crop Water Requirements' to get a graph of your crop water requirements. Within the same graph, you can also get an ET crop by selecting the 'ET crop' option below the graph. You can also select whether those will show either as a bar or a curve.
Part 7 of 7:
Developing your irrigation schedule
-
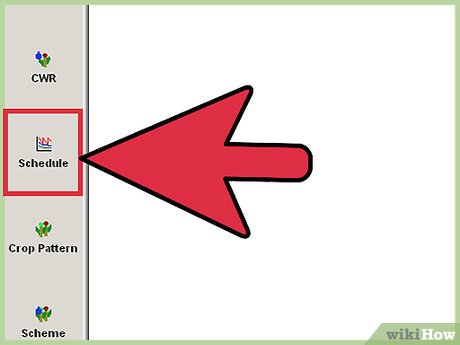
 Click on the 'Schedule' button on the left side panel to get a tailored irrigation schedule.
- By clicking on the 'Schedule' button, you will get a table of irrigation schedule and a table of daily soil moisture balance. You will get information on:

- total gross irrigation,
- total net irrigation,
- total irrigation losses,
- total percolation losses,
- actual water use by crop,
- potential water use by crop,
- effective rainfall,
- total rain loss,
- moist deficit at harvest,
- actual irrigation requirement, and
- yield reduction.
- By clicking on the 'Schedule' button, you will get a table of irrigation schedule and a table of daily soil moisture balance. You will get information on:
-
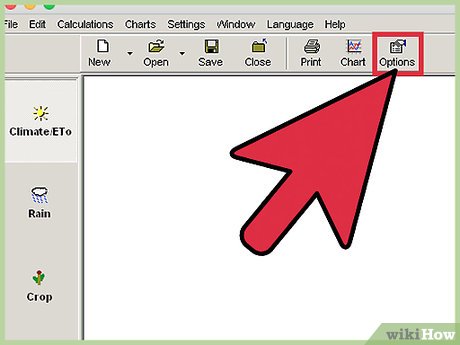
 Click on the 'Options' button to modify the scheduling based on different irrigation timing, irrigation application system and irrigation efficiency. The available irrigation timing options are:
- irrigation at fixed water depth,
- irrigation at fixed % desaturation,
- irrigation at fixed % of critical depletion,
- irrigation at fixed WD/desaturation/critical depletion per stage,
- irrigation at fixed interval per stage,
- irrigation at given ET crop reduction,
- irrigation at given yield reduction,
- irrigate continuously,
- no irrigation (rain-fed).
-
 Check the other available irrigation application options to see if these are needed too. These include:
- user-defined application depth,
- refill to fixed water depth,
- refill to or below saturation,
- refill to or below field capacity,
- refill to fixed WD/saturation/FC,
- fixed application depth.
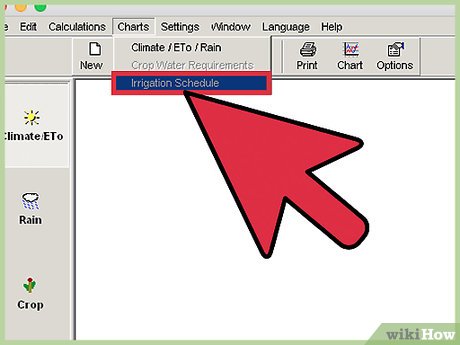
- Get an irrigation schedule graph. Click on the 'Charts' menu, then click on 'Irrigation Schedule' to get a graph of your irrigation schedule. Below the graph, you can select options (for example, depletion soil moisture, depletion saturated water, RAM root zone, TAM root zone, SAT root zone, TAM whole puddle and SAT whole puddle), which you can either show or hide in the graph.
Share by
Jessica Tanner
Update 05 March 2020

