How to Debug Javascript
The ability to debug code is an essential tool in any programmer's arsenal. Debugging will give you inside information into how your program is functioning, in real-time, as it runs. Javascript offers a unique but familiar method of...
Table of Contents
Method 1 of 2:
Using the Debugger; Statement
-
 Determine if debugger; is the correct tool for this situation. Ask yourself:
- Do I need to look at this in great detail?
- Do I want to know the values, and the path the program is taking?
- Can I effectively test this through the developer window?
-
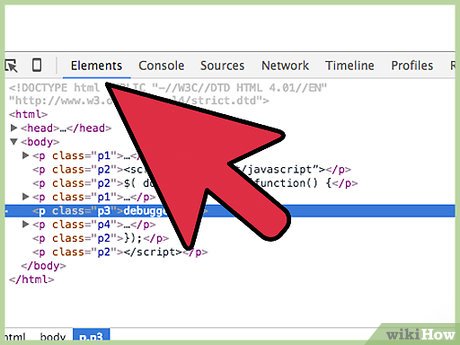
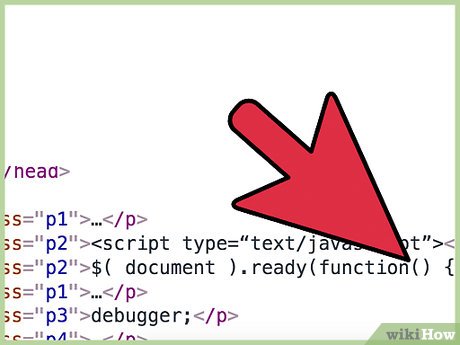
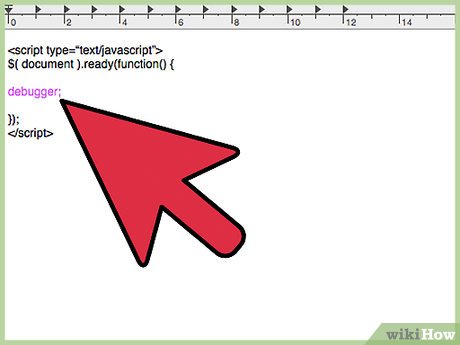 Before the problem area, enter the statement: debugger;
 -
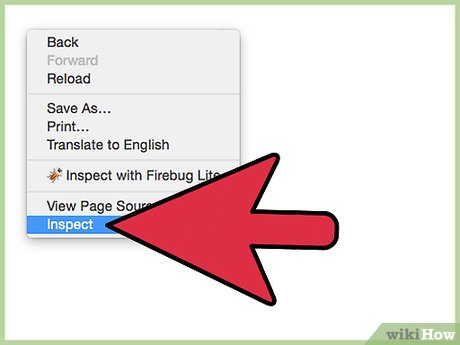 Open your browser's developer tools by right clicking and selecting inspect element. This will be browser specific, but they should all work very similarly.
 -
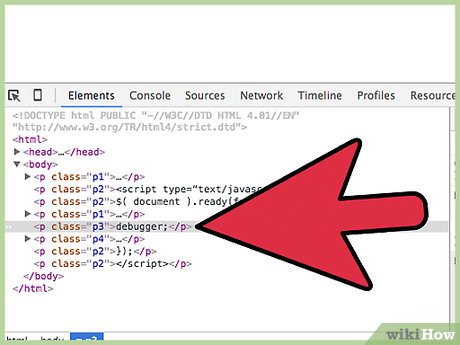 Once inside of developer tools, run your code again. This time it will stop at the debugger; statement.
 -
 Step through your program, line-by-line, by pressing F10.
 -
 Repeat the process as necessary. You may have to restart your program to trigger the debugger; again.
 -
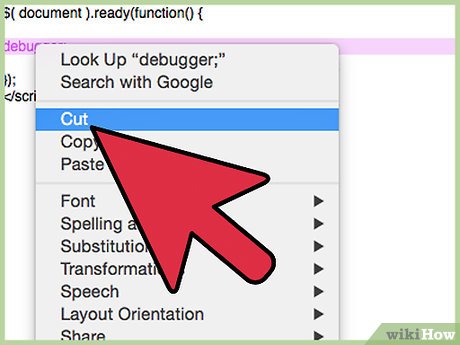 Once you've used the debugger to solve the problem, be sure to remove the statement when you're done.
Method 2 of 2:
Using an Alert();
-
 Determine if alert(); is the correct tool for this situation. Ask yourself:
- Do I only need to know if a certain part of the program is running?
- Do I only want to know one value, and timing is not important?
-
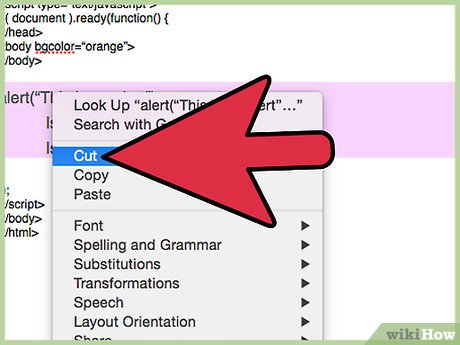
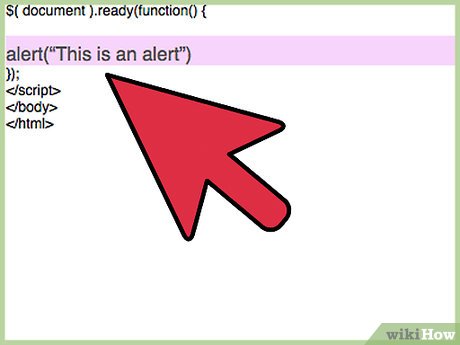 After the problem area, enter the statement: alert();
- Note that this alert will print, "This is an alert." To the screen. This could be any value.
-
 Run your code as normal.
- Once this point is reached, it will create a popup on your screen with whatever information put into the argument of alert();
-
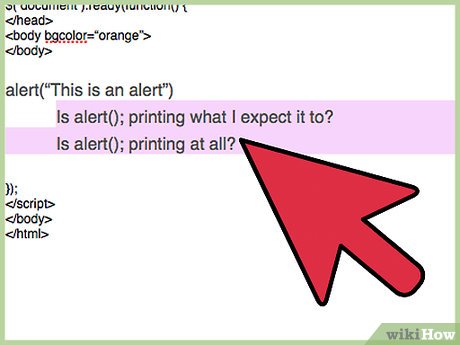 Use the information from the alert(); to solve the issue.
- Is alert(); printing what I expect it to?
- Is alert(); printing at all?
-
 Repeat the process as necessary. You may have to restart your program to trigger the alert(); again.
 - Be certain to remove the alert(); statement when you're done.
Was this article helpful?
Your feedback helps us improve.
Related Articles
 Debug in JavaScript7 minutes read
 Syntax of JavaScript4 minutes read
 Google Chrome and Edge encountered strange errors, automatically generated random debug.log files on the desktop3 minutes read
 What is JavaScript? Can the Internet exist without JavaScript?10 minutes read
 Instructions on running Node JavaScript code in n8n7 minutes read
 What is Currying in Javascript? How to use Currying in JavaScript4 minutes read
Reader Comments 0
Sign in with email or Google to join the discussion.