How to Debug a Node.js Application in Visual Studio Code
You don't need an external debugging tool. You can debug your Node.js application right in the VS Code editor using built-in tools.
Debugging a Node.js application in Visual Studio Code is very simple. The VS Code editor has built-in debugging capabilities for any app that targets the Node.js runtime. That means that you can debug JavaScript or any other compiled language (eg TypeScript).
This article will guide you step by step through debugging Node.js application in VS Code. You will learn how to start a debugging session, insert breakpoints, attach an external process, and debug TypeScript code using source maps.
Prepare
Before starting, install Node.js and VS Code on the local machine. The latest version of Node.js is available on its official website. Similarly, for Visual Studio Code, download the latest version from the VS Code web. You can refer to How to install Visual Studio Code on Windows 10 at TipsMake.
You also need a Node.js project. You can create a simple Node.js application from scratch or use an existing one.
Debugging in VS Code
Starting debugging in the VS Code editor is pretty straightforward. Open the file with VS Code and click the Run and Debug icon in the sidebar (or press Ctrl + Shift + D on the keyboard). Next, click the Run and Debug button to start the process.
By default, Node.js will try to figure out the project's debug environment. However, if the automatic detection fails, it prompts you to select the appropriate environment. In this tutorial, the environment is Node.js.
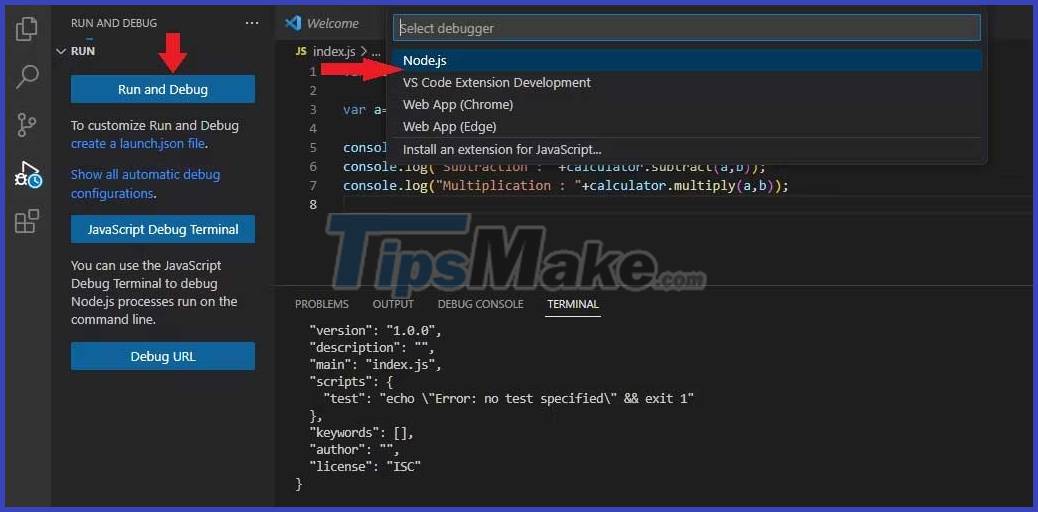
Once the environment has been selected, VS Code activates the debugger and attaches it to the process. You can see the results in DEBUG CONSOLE . Using the debug toolbar at the top, you can loop code, pause execution, or end the session.
You also have the option to create a configuration file. The launch.json file allows you to configure and set debugging details. If the script needs an argument, provide these arguments in the launch.json file. Multiple options can be set per profile:
{ "version": "0.2.0", "configurations": [ { "type": "node", "request": "launch", "name": "Launch Program", "skipFiles": [ "/**" ], "program": "${workspaceFolder}index.js" } ] }You will also see 5 panels on the left hand side of the editor, including: VARIABLES, WATCH, CALL STACK, LOADED SCRIPTS, and BREAKPOINTS :
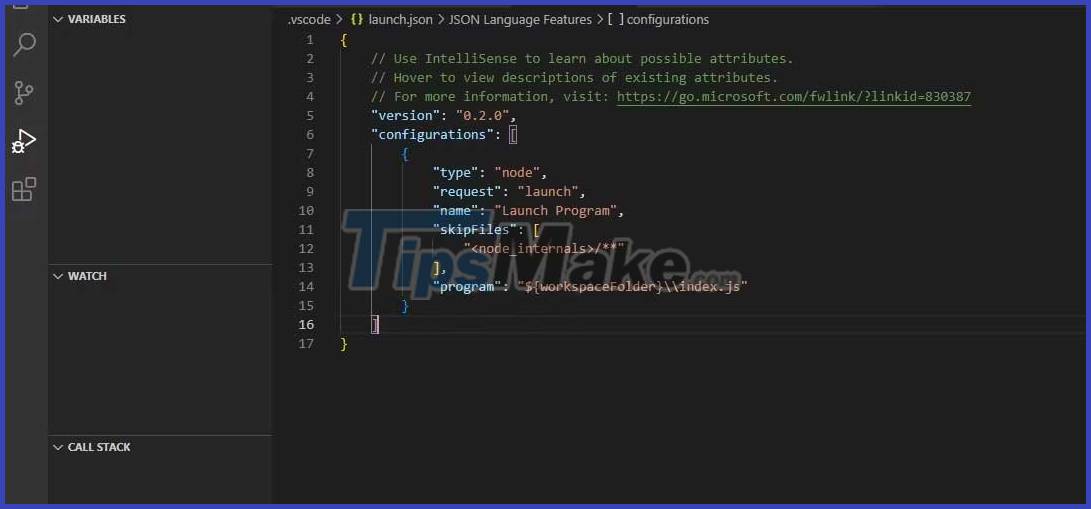
When the configuration is complete, select and run the program through the configuration menu.
Attach an external process
Another method to set up a Node.js debugging session is to attach an external process. Start the program with the following command:
node --inspect index.jsInsert the -brk flag after --inspect if you want to attach it before this program starts running.
Next, open select this process in VS Code. This lists all the processes available in the Node.js environment. To open the selector, press Ctrl + Shift + P and look for the command Debug: Attach to Node.js .
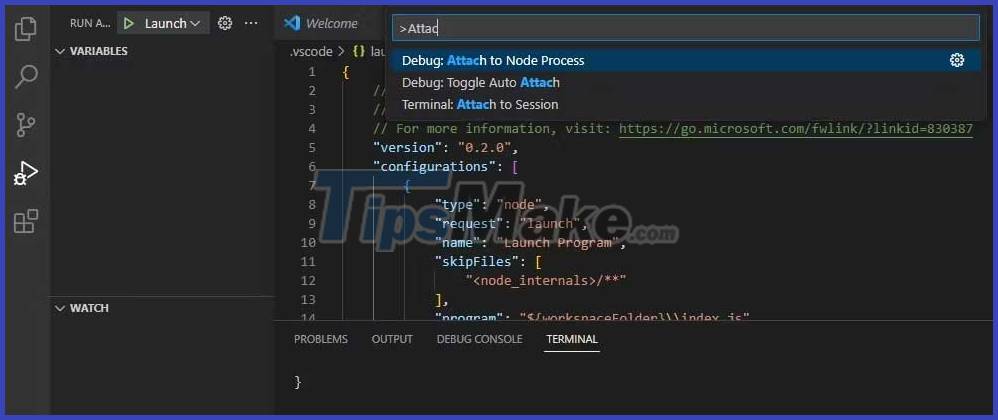
Click this command and make the appropriate choice to start the debugging process.
Create breakpoints
If you want to pause at specific points in the program to check the code, set the breakpoint there. You can set breakpoints almost anywhere in your code. This includes variable declarations, expressions, and comments. But you can't set breakpoint in function declaration.
Creating a breakpoint is quite simple. When moving the mouse to the left of the line numbers, a red circle appears on each line. Specify the number of lines in the code where you want to insert the breakpoint. Then click on that line to add a breakpoint:
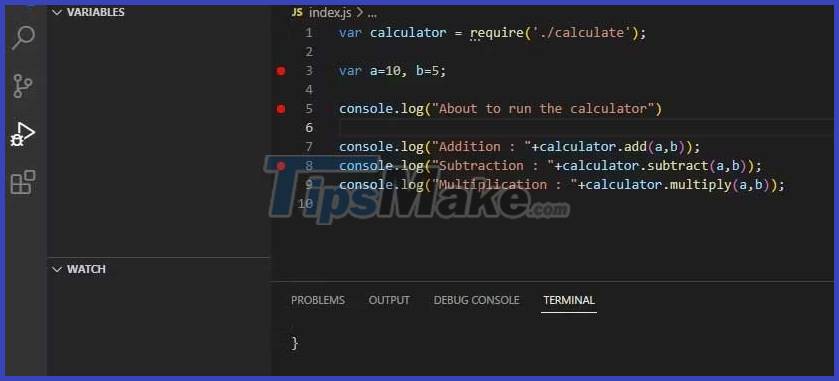
In BREAKPOINTS , you will find all the breakpoints enabled in the project. This is where you will manage, edit, and disable breakpoints. You can also pause the code when running an uncaught exception or exception. This allows you to check for problems before exiting the process.
Take a look at the breakpoints in action. Click the Launch icon to start a debugging session. This program will pause at the first breakpoint and output the value to check:
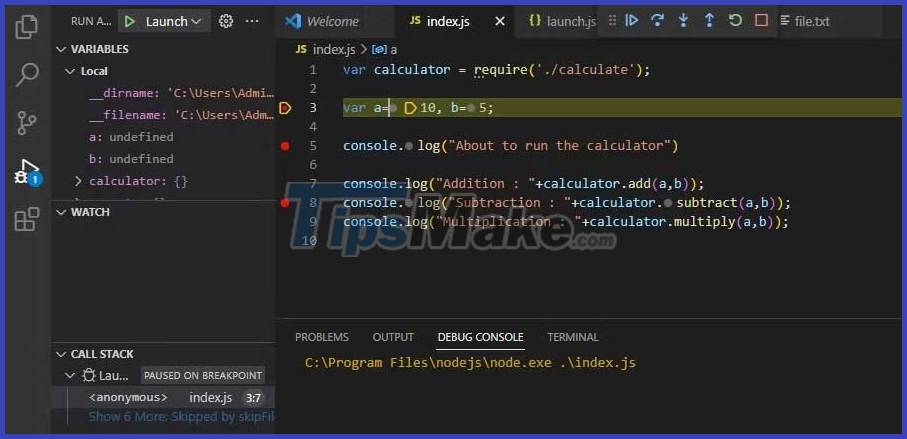
You can click the Continue icon (or press F5 ) to move this program to the next breakpoint. This will continue until you reach the end of the program.
Debugging TypeScript with source maps
As Typescript becomes more and more popular, the number of Node.js projects written in TypeScript will surely increase. Fortunately, you can also debug TypeScript-based projects using VS Code.
First, create a tsconfig.json file in the project root directory and enable source mapping:
{ "compilerOptions": { "sourceMaps": true }}Next, attach the runtime and set the breakpoint in the TypeScript file. Visual Studio Code will find source maps and use them.
You can explicitly tell VS Code where the source map is to be found. To do this, add the outFiles property in the launch configuration file and point it to the exact location of the source map:
{ "version": "0.2.0", "configurations": [ { "type": "node", "request": "launch", "name": "Launch Program", "skipFiles": [ "/**" ], "program": "${workspaceFolder}index.js", "outFiles": "${workspaceFolder}index.js", } ] }If you're using ts-node to run the project without going through the build step, use this instead of the configuration file above:
{ "version": "0.2.0", "configurations": [ { "type": "pwa-node", "request": "launch", "name": "Launch Server", "skipFiles": [ "/**" ], "runtimeArgs": [ "-r", "ts-node/register" ], "args": [ "${workspaceFolder}/src/server.ts" ] }] }Since there is no program attribute, the args runtime registers ts-node as a handler for the TypeScript file. The first argument of args is the input file for this program. You can now start a debugging session. If you're coding in vanilla JavaScript or a front-end framework, you can also debug JavaScript code in the browser.
Above is how to debug Node.js application in Visual Studio Code . Hope the article is useful to you.
Discover more
Share by
David PacYou should read it
- 10 tips for Microsoft's cross-platform code editing tool - Visual Studio Code
- Visual Studio Code now has an extremely useful color picker
- How to Install Visual Studio Code on Ubuntu 20.04
- How to install Visual Studio Code on Windows 10
- Compare 2 Visual Studio Code and Atom editors
- The Quiet Details That Make a Sports Betting Platform Feel Reliable
- Instructions on creating toy set images with ChatGPT AI
- How are AI agents changing the journalism industry?
- How to Build a GraphQL API with Apollo Server and MongoDB
- CONCAT vs. TEXTJOIN: Which function should I choose to concatenate data?
- How to enable 3-column widget panel in Windows 11