Making whiteboard lessons more engaging through conversation with Claude.
Let's explore how to teach a concept by having Claude create illustrative sketches. The images will be incorporated as part of the interactive process – a thinking tool for initial preparation, and a teaching tool if you wish to further develop the idea..
Let's explore how to teach a concept by having Claude create illustrative sketches. The images will be incorporated as part of the interactive process – a thinking tool for initial preparation, and a teaching tool if you wish to further develop the idea.
1. Job Description
You're trying to teach something – where do students typically struggle, what expression will be more effective, is your usual diagram still suitable? Claude can think about that with you, and a visual representation will be incorporated as part of the discussion, making the rephrasing more concrete along with advice. The drawing does two things at once. It helps you express yourself more clearly – seeing it in motion makes the teaching script self-contained – and it's the first draft students can use, with a roadmap from preparation to in-class tools whenever you want.
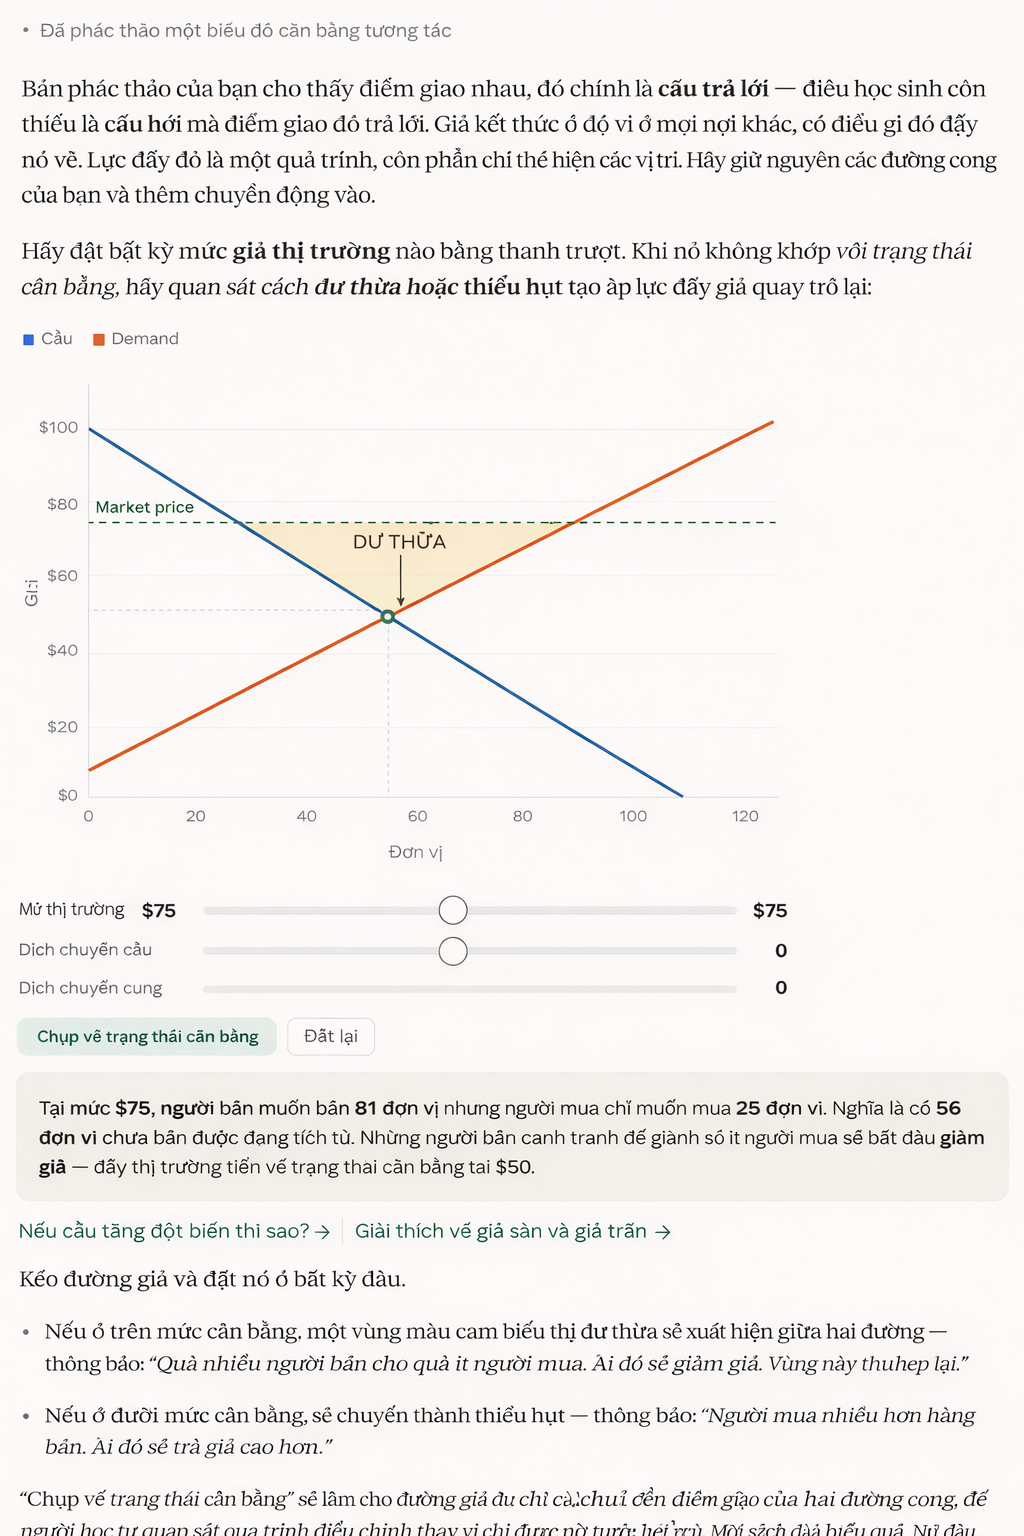
Here, a professor is planning a lecture on supply and demand equilibrium for next week. The professor attaches the diagram they used and asks Claude to help think about why students are having trouble with this section. The response is both teaching advice and an interactive diagram – and the diagram continues to evolve as the conversation progresses.
Tôi đang chuẩn bị dạy về cân bằng cung cầu vào tuần tới. Đây là sơ đồ tôi đã sử dụng - sinh viên thường theo dõi điểm giao nhau nhưng không hiểu tại sao giá lại ở đó. Có cách nào tốt hơn để diễn đạt điều này không? Và liệu có cách nào để cho họ thấy áp lực hướng tới trạng thái cân bằng, chứ không chỉ là điểm giao nhau?2. Provide context for Claude.
Attach what you used—a sketch, a slide, an unfinished example. Claude will read your presentation framework and work on it, so what he receives will expand on your explanation, not replace it.
Context required : A photo of the whiteboard, a slide, or a description of what you have drawn.
3. What Claude created
The answer is a conversation about the teaching material with visuals interwoven throughout. Claude diagnoses why the static sketch is difficult for students to understand—a concept of movement needs to move—providing a reinterpretation, and the interactive version appears where that reinterpretation appears: curves, a slider that students will drag, a display panel recording wherever they place their price. The diagram is a tool to aid thinking first. What you do with it is secondary.
4. Subsequent prompts
Continue the conversation with Claude to refine, expand, or explore further.
I asked Claude to redraw it with a minor change.
Describe a change in the interaction and Claude will redraw it - you tell him the difference, and the image will be updated.
Thêm một bước trước nút bắt điểm: Sinh viên dự đoán giá sẽ di chuyển theo hướng nào trước, sau đó nhấp để kiểm tra. Hiển thị dự đoán của họ bên cạnh những gì đã xảy ra.Click a button in the image to see the next scenario.
The buttons below the chart will send the next prompts – click a button and Claude will build a second image for that scenario. The balance chart remains at the top.
Điều gì xảy ra khi nhu cầu tăng đột biến? Cho tôi thấy các đường cong dịch chuyển và vị trí cân bằng mới.Claude was asked to rebuild the same format for a different concept.
Claude rebuilt the same pull-predict-test interaction around the new concept—this time with a price floor, along with catch points and different curves.
Vẽ lại biểu đồ này cho giá sàn và giá trần - vẫn giữ nguyên định dạng dự đoán rồi khớp, nhưng hãy chỉ ra lý do tại sao khoảng cách không thu hẹp lại.5. Tips, tricks, and troubleshooting
The way you phrase your question will shape the outcome you receive.
"Students are following the intersection but don't understand why the price is going there" tells Claude which misconception to build the chart on—a general statement will create a general chart. Attach what you used, clearly state where the students are having trouble, and the image will be shaped around that specific gap.
Compare the image to your own understanding.
The "predict and match" interaction is Claude's prediction of what will help your students – it's one way to build the graph, and it might not be suitable for your class. Experiment with a few students before deciding to use it. If they click without the prediction, or the surplus area doesn't appear, that's worth noting – let Claude know what happened and the next version will be built upon what you saw.
What's the next step with the image?
When the image closely resembles something students can use themselves, hover over the image to see the options. Saving as Artifact will turn the whiteboard draft into a link students can open themselves. Creating skills from images helps Claude remember interactive shapes – the next time you present a different concept, you'll get the same pull-predict-test format without having to rebuild the idea.