Table of Contents
A website can feel fast on one device and slow on another. The reliable way to assess it is to combine real-user data with repeatable lab tests, then inspect the requests and page elements causing delays. A single score is useful for comparison, but it is not a complete diagnosis.

Field data and lab data answer different questions
Field data comes from real visits. It reflects the mix of devices, networks, locations, and interactions that actual users experience. Lab data is collected under controlled conditions and is better for reproducing problems before and after a change.
Use both when possible. A lab run may be slow because of its simulated device or location even when field data is healthy. Conversely, a fast desktop test can hide problems affecting mobile visitors. Low-traffic or new pages may not have enough field data, so lab testing becomes especially important.
Start with PageSpeed Insights
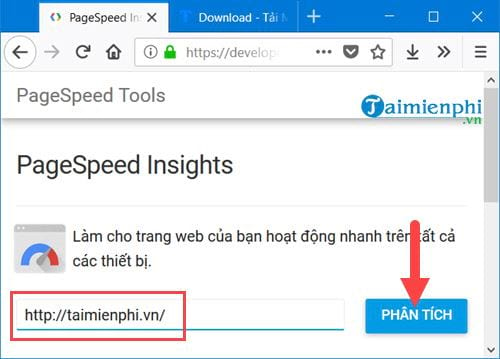
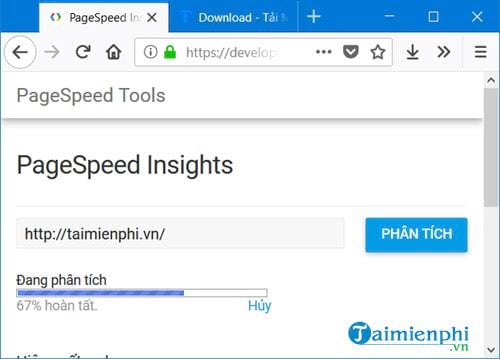
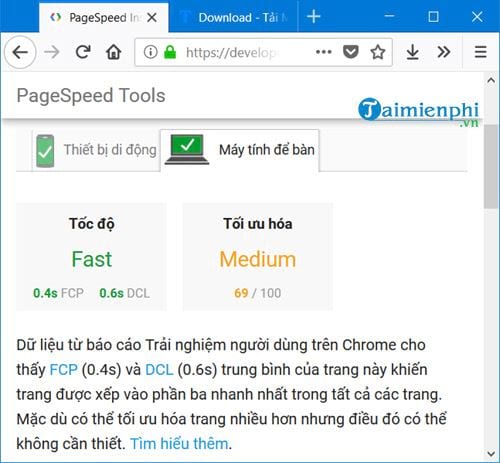
- Open PageSpeed Insights, enter the exact page URL, and select Analyze.
- Review mobile and desktop results separately.
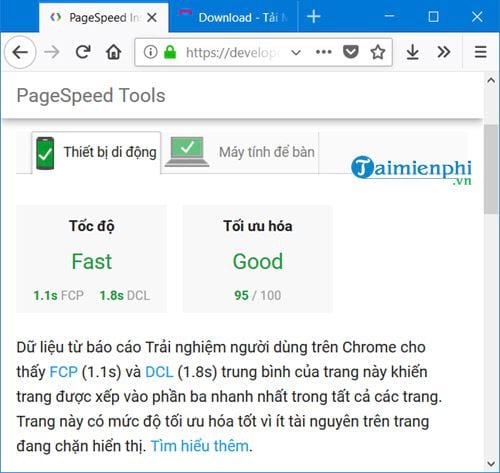
- If field data is available, check whether the URL passes the Core Web Vitals assessment. Then use the Lighthouse diagnostics to find likely causes.
- Retest after making changes instead of treating every suggestion as mandatory.
Core Web Vitals to check
| Metric | What it measures | Good experience |
|---|---|---|
| LCP | How quickly the largest visible content element appears | 2.5 seconds or less |
| INP | How promptly the page responds to user interactions | 200 milliseconds or less |
| CLS | How much visible content unexpectedly shifts | 0.1 or less |
These targets are evaluated at the 75th percentile of page visits. See the current definitions in Google's Core Web Vitals documentation. Lighthouse may show Total Blocking Time as a lab diagnostic related to responsiveness; it is not the same measurement as field INP.

About the older Google mobile-test screens
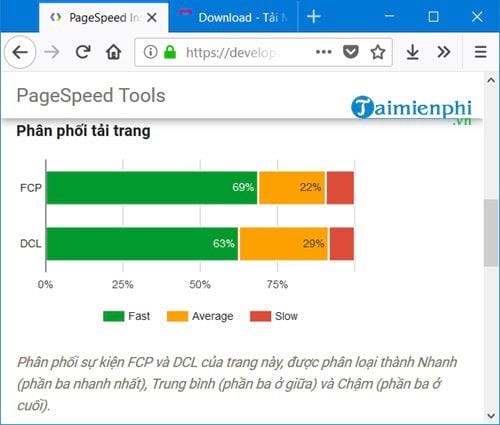
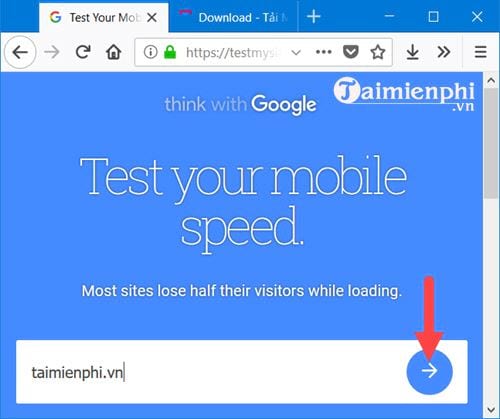
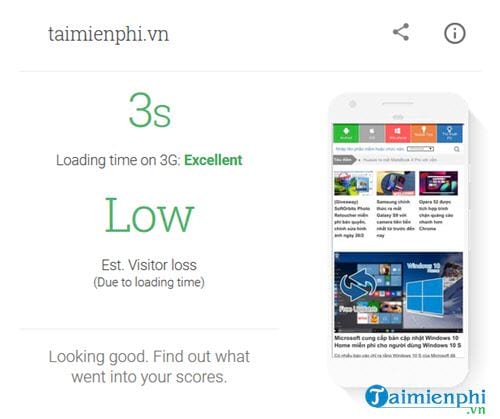
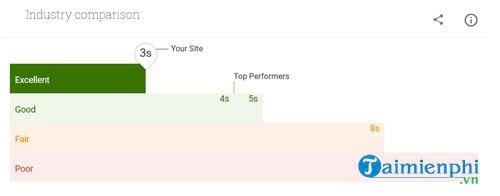
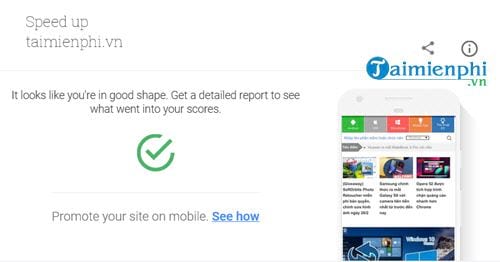
The following screenshots show an older Google mobile testing workflow. They remain useful as a historical reference, but the interface is not the current speed-testing process. For present-day checks, use PageSpeed Insights for mobile performance and Chrome Lighthouse for a controlled audit. Also test the page on a real phone, because automated tools cannot verify every navigation or interaction issue.
Use Pingdom for a second lab test
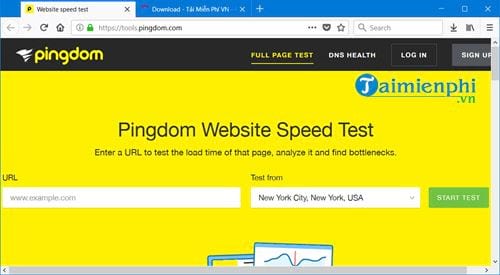
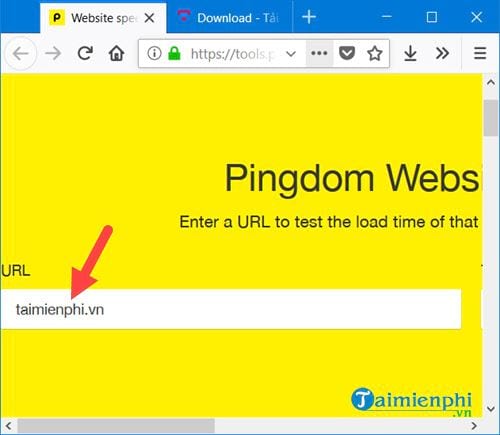
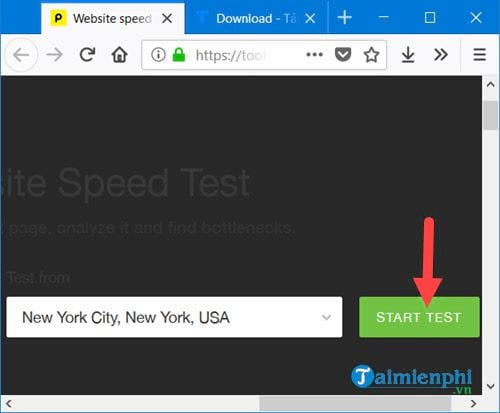
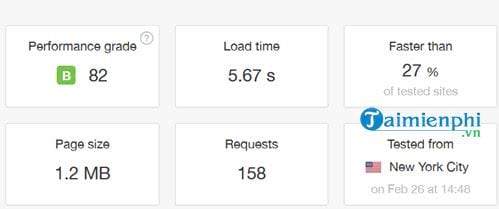
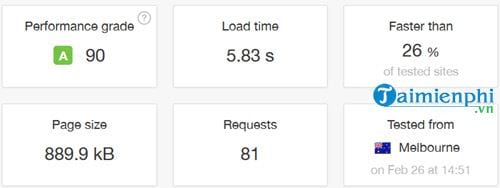
Pingdom Website Speed Test provides another synthetic measurement and a request waterfall. Enter the page URL, select an available test location that resembles your audience, and run the test. Location choices can change, so record the location whenever you compare results.
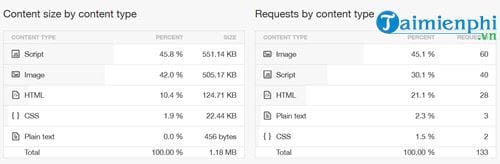
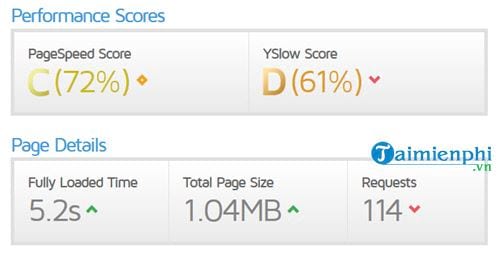
Do not focus only on the headline grade. Check total transfer size, request count, load timing, and the waterfall. Long connection phases can indicate DNS, TLS, network, or server delays. Large downloads point to heavy images, fonts, scripts, or video. A request that starts late may be blocked by earlier CSS or JavaScript.
Use GTmetrix to inspect structure and requests
GTmetrix uses Lighthouse-based testing and presents performance, structure, and waterfall information. Test the same URL and choose a representative device, connection, and region when those controls are available for your account.
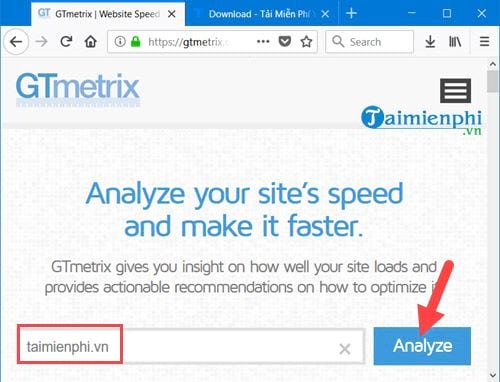
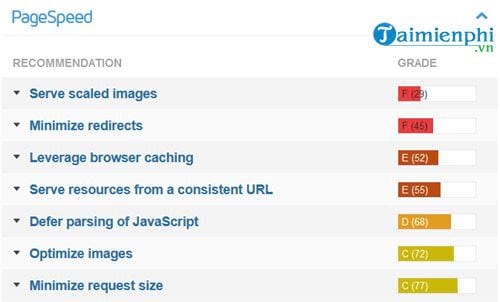
The screenshots below show an older GTmetrix report, so labels and scoring may differ from the current interface. The diagnostic method is still relevant: identify the slowest requests, the largest assets, long main-thread work, redirects, and third-party code. The waterfall is usually more actionable than a score by itself.
Run tests that can be compared
- Test the exact canonical URL, not only the homepage.
- Check important templates such as an article, category, search page, product page, and checkout.
- Use the same device, connection, location, and tool settings for before-and-after tests.
- Run several tests and compare the median result; one run can be distorted by network or server variation.
- Test both cold-cache and repeat-visit behavior when caching matters.
- Include authenticated pages or key interactions if users spend time there.
Turn the report into a prioritized fix list
- Slow server response: inspect hosting, database work, application processing, cache rules, redirects, and CDN configuration.
- Slow LCP: optimize the main image or content block, preload only critical assets, and avoid delaying it behind scripts. TipsMake's image compression guide explains practical ways to reduce oversized image files.
- Render-blocking resources: load only critical CSS early and defer nonessential JavaScript. Minifying HTML, CSS, and JavaScript can reduce transfer size, although it will not fix inefficient code by itself.
- Poor responsiveness: split long JavaScript tasks, reduce third-party scripts, and test the actual interactions that users perform.
- Layout shifts: reserve dimensions for images, ads, and embeds; manage font loading; and avoid inserting content above existing elements.
- Too many requests: remove unused libraries, duplicate trackers, and unnecessary widgets before trying to conceal them with caching.
For additional page and domain diagnostics, browse the TipsMake website tools. After each meaningful change, repeat the same test configuration and confirm the result with both lab measurements and real-user data where available.
Related Articles
 How to Check Your Website Speed Fast or Slow5 minutes read
 Check Your Current Network Speed Fast or Slow4 minutes read
 View IP Website: How to Check Website IP Address // Domain Name5 minutes read
 Check Website IP, Check the IP Address of Any Domain6 minutes read
 Check IMEI iPad - Check IMEI iPad Fast and Most Standard2 minutes read
 2 Ways to Check RAM and Check RAM Errors on the Computer with the Highest Accuracy Rate7 minutes read
Reader Comments 0
Sign in with email or Google to join the discussion.