GROWTH function - The function calculates the exponential growth value using existing data in Excel
GROWTH function: The function calculates the exponential growth value using existing data. Syntax: GROWTH (known_ys, [known_xs], [new_xs], [const])
The following article introduces you to the GROWTH function - one of the functions in the statistical function group is very popular in Excel.

Description: The function calculates the exponential growth value using existing data.
Syntax: GROWTH (known_y's, [known_x's], [new_x's], [const])
Inside:
- known_y's : The set of known y values in the relationship y = b * m ^ x, is a required parameter.
+ If known_y's is in a single column or row -> each known_y's column or row is interpreted as a separate variable.
- known_x's: The set of known x values in the relationship y = b * m ^ x, is a required parameter.
+ known_x's may include 1 or more sets of variables.
+ If known_x's is omitted -> it is assumed to be an array of the same size as known_y's
- new_x's: Are the new x values that you want the function to return the values corresponding to the values of y.
+ new_x's must include a column (row) for each independent variable.
+ If new_x's is omitted -> it is assumed to be the same as known_x's.
+ If known_x's and new_x's are omitted -> it is assumed to be the same as known_y's size .
- const: The logical value determining the value of the constant b, is an optional value including the following values:
+ const = True or ignore -> b is calculated normally.
+ const = False or ignore -> b = 1 and m are adjusted such that: y = m ^ x.
Attention:
- The value of the returned formulas has the array formula type -> the function must be entered as an array formula.
- When entering values for an argument with the following convention:
+ Use commas to separate values in the same row.
+ Use semicolons separating between rows together.
For example:
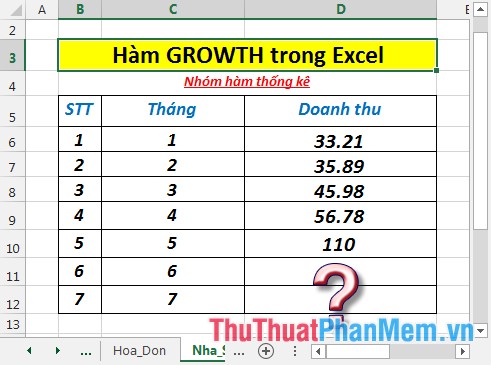
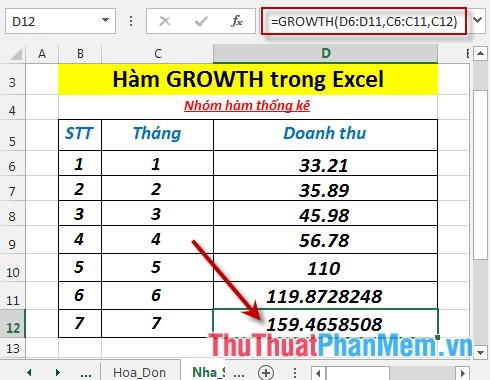
Calculate the estimated revenue for the 6th and 7th months based on the previous sales month in the data table below:
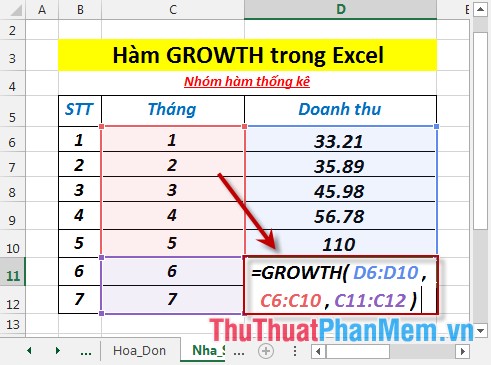
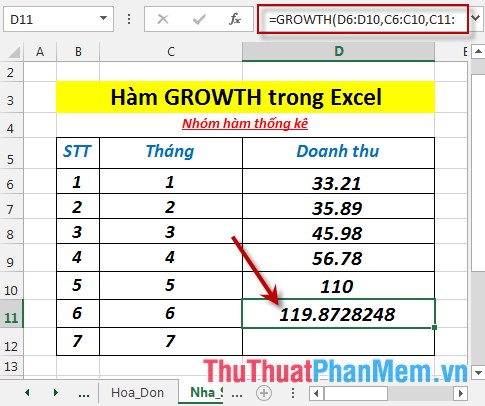
- Calculate the expected revenue of the 6th month. In the cell to calculate enter the formula : = GROWTH (D6: D10, C6: C10, C11: C12)
- Press Enter -> predicted revenue of the 6th month is:
- Calculate the predicted revenue of the 7th month. In the cell to enter the formula : = GROWTH (D6: D11, C6: C11, C12)
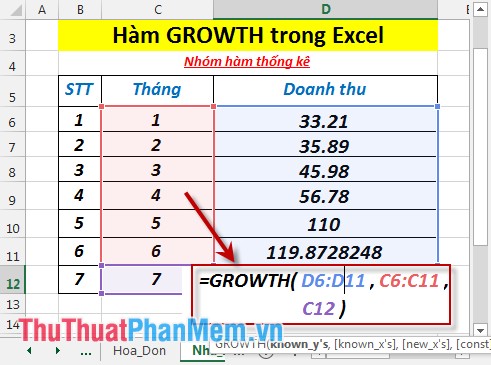
- Press Enter -> predicted revenue of the 7th month is:
Above are instructions and some specific examples when using GROWTH function in Excel.
Good luck!
Was this article helpful?
Your feedback helps us improve.
Related Articles
 Power function (exponential) in Excel2 minutes read
 Exponential functions in Excel - Usage and examples2 minutes read
 LOGEST - The function returns an array of data that describes an exponential curve that fits the data given in Excel4 minutes read
 How to use the DAVERAGE function in Excel3 minutes read
 SUMPRODUCT function in Excel: Calculates the sum of corresponding values5 minutes read
 The EXPON.DIST function - The function returns the exponential distribution in Excel2 minutes read
Reader Comments 0
Sign in with email or Google to join the discussion.