The MODE function (returns the value with the most frequent occurrence in an array or data range) in Excel
MODE returns the most frequently occurring, repeated value in a given data array. MODE is not as common as other functions, but sometimes you still have to use MODE to get statistics when needed.
Table of Contents
MODE returns the most frequently occurring, repeated value in a given data array. MODE is not as common as other functions, but sometimes you still have to use MODE to get statistics when needed.
The following article describes the syntax and usage of the MODE function in Excel.
Description
The MODE function returns the value with the most frequent occurrence in an array or data range.
Syntax
= MODE (number1, [number2] .)
Inside:
- number1: the first argument that you want to calculate weak, required.
- number2: the next argument is an optional argument and a maximum of 255 arguments.
You can use a single array or reference an array instead of arguments.
Note
- Arguments can be numbers, arrays, or references that contain numbers.
- Arguments that are text or error values that cannot be converted into numbers will cause the function to fail.
- If an argument, reference, or array contains a logical value, text, or a blank cell, it will be ignored, cells with a value of 0 will be counted.
- If no argument is repeated more than 2 times, the function displays an error.
- There are many numbers with the same frequency of occurrence, the result will be the first argument appears.
For example
Find the number with the most frequent occurrence in the Values column in the data table:

You can apply the MODE function with the arguments that contain cells separated by commas as follows: = MODE (C6, C7, C8, C9, C10, C11).
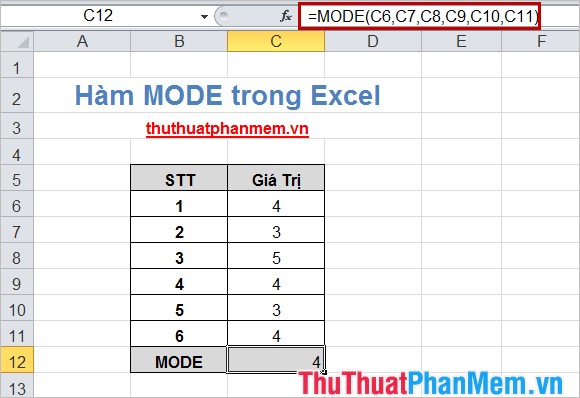
In addition, you can also apply the MODE function with an array argument containing the values: = MODE (C6: C11).

Although the MODE function has now been replaced by new functions with greater accuracy and names that reflect their uses, MODE is still used. With the syntax and usage of the MODE function is very simple, you can easily use the function. Good luck!
Was this article helpful?
Your feedback helps us improve.
Related Articles
 GEOMEAN function - The function returns the average of a positive array or range of data in Excel2 minutes read
 How to use the Match function in Excel5 minutes read
 MODE.SNGL function - Function that returns the most frequently occurring, or the most repeated values in an array or data range in Excel3 minutes read
 MODE.MULT function - The function returns a vertical array of the most common values in Excel3 minutes read
 The Match function (the function searches for a specified value in an array or cell range) in Excel4 minutes read
 LOOKUP function searches in Excel5 minutes read
Reader Comments 0
Sign in with email or Google to join the discussion.