PERCENTILE.INC function - Function returns the kth percentile of values in the range with k in the range from 0 to 1 in Excel
PERCENTILE.INC function: The function returns the kth percentile of values in the range with k in the range from 0 to 1. Syntax: PERCENTILE.INC (array, k)
The following article introduces you to the PERCENTILE.INC function - one of the functions in the statistical function group is very popular in Excel.

Description: The function returns the kth percentile of values in the range with k between 0 and 1.
Syntax: PERCENTILE.INC (array, k)
Inside:
- array: An array or range of data to determine percentile, which is a required parameter .
- k: Percentage value in the range from 0 to 1 including 0 and 1, is a required parameter .
Attention:
- If array array value is empty -> the function returns the #NUM! Error value .
- If the value of k is not a number -> the function returns the error value #VALUE! .
- If k ≤ 0 or k ≥ 1 -> the function returns the #NUM! Error value
- If k is not a multiple of 1 / (n - 1) -> interpolation function to determine the kth percentile value.
- PERCENTILE.EXC function will interpolate when the percentile return value is between two values in the array. Where the function cannot be interpolated -> the function returns the #NUM! Error value
For example:
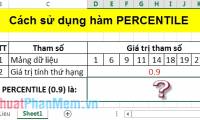
Find the value of 0.56 percentile in the dataset in the data table below:

- In the cell to calculate enter the formula : = PERCENTILE.EXC (E6: K6,0.56)

- Press Enter -> 0.56 percentile value in the dataset is:

- With PERCENTILE.EXC function, the first 2 values 0 and 1 within the function still perform calculations.
+ With value k = 1:

+ With value k = 0:

Above are instructions and some specific examples when using PERCENTILE.INC function in Excel.
Good luck!
Was this article helpful?
Your feedback helps us improve.
Related Articles
 PERCENTILE function - The function returns the kth percentile in Excel2 minutes read
 PERCENTILE.EXC function - The function returns the kth percentile of values in the range, with k in the range from 0 to 1 in Excel2 minutes read
 QUARTILE.EXC function - The function returns the quartile of a dataset without values 0 and 1 in Excel2 minutes read
 QUARTILE.INC function - The function returns the quartile of a dataset including values 0 and 1 in Excel3 minutes read
 FREQUENCY function - Function that calculates and returns the frequency of occurrences of values in a range in Excel2 minutes read
 PROB function - The function returns the probability that values in a range are between two limits in Excel3 minutes read
Reader Comments 0
Sign in with email or Google to join the discussion.