Table of Contents
This updated guide examines Troubleshooting Forefront Tmg and organizes the essential facts, background, and practical takeaways in clear American English.
Troubleshooting the Forefront TMG problem is often complicated and time-consuming because the cause of the problem is so much. To make it easier to find the cause, in this tutorial we will show you some Forefront TMG troubleshooting tools and techniques. However, note that the article does not provide a solution for a specific problem, but only provides a technical overview and troubleshooting tool so you can use it to overcome some problems. his specific.
With this article, we will give you some information about the following tools and techniques:
- Forefront TMG Dashboard
- Forefront TMG Logging
- Windows Event viewer
- Forefront TMG log file
- Forefront TMG Best Practice Analyzer
- Forefront TMG Data Packager
- Microsoft Network Monitor (Netmon)
- Tools included with TMG
- NETSH
- Forefront TMG Diagnostic Logging
- FWENGTRACE
- ISATRACE
- Perfmon
- PAL (Performance Analysis of Logs)
- TMG Superflow
Forefront TMG Dashboard
Forefront TMG Dashboard is the first component that Forefront TMG administrators should investigate because it provides you with 'health' status information for the Forefront TMG Server.
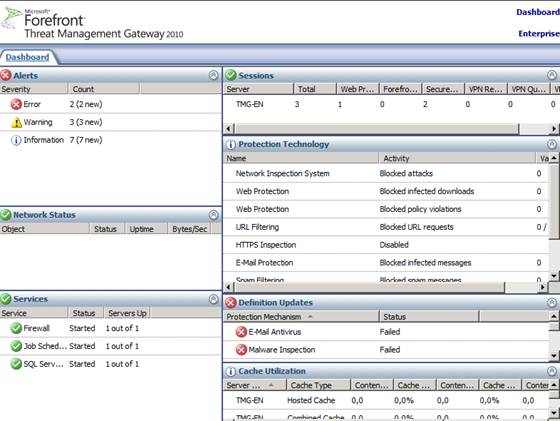 Figure 1: Forefront TMG Dashboard
From Forefront TMG Dahsboard, you can easily navigate to the Alert section, where you'll get more details for each specific alert. If you want to be notified via email, the program can create notifications when there are alerts.
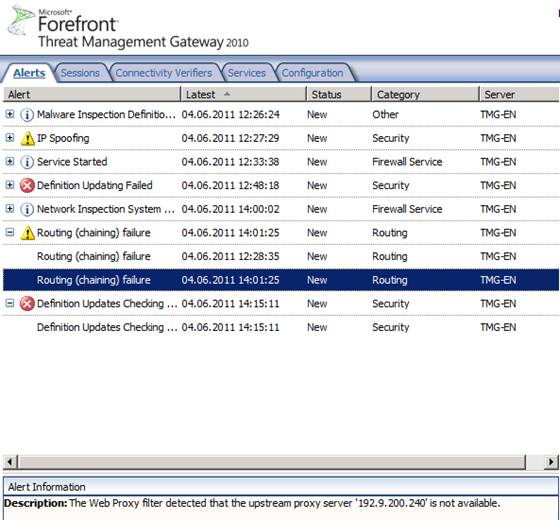 Figure 2: Forefront TMG Alerts
Forefront TMG logging
One of the most used features in Forefront TMG is real-time logging, which allows you to view traffic from servers and clients in real time. TMG logging is a great tool if you want to allow network traffic from an application, server or client, but don't know what open media ports should be opened.
 Figure 3: Forefront TMG Logging
Windows Event Viewer
Another important tool for troubleshooting TMG is Windows Event Viewer. Forefront TMG will record a lot of useful information in the Application and System event log categories and specific information about ADAM (AD-LDS) in the Application and Services Log. The ISA Server Diagnostic Logging by default is completely empty, and you must enable this feature yourself.
 Figure 4: Windows Event Logging
Log file
In the installation of Forefront TMG, the installation process will create some log files in the% windir% temp folder and after a successful installation, you will see some log files like ISA_UpdateAgent, this is the file provided details about TMG Web Protection platform upgrades.
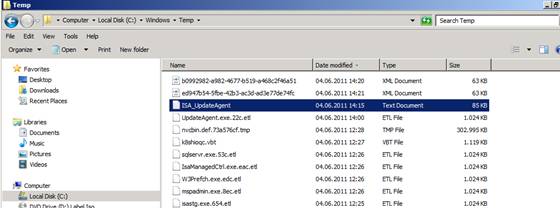 Figure 5: Forefront TMG log file
Forefront TMG Best Practices Analyzer
Perhaps most of you already know about TMG Best Practices Analyzer compared to the current Forefront TMG installation. TMG BPA should be the first tool to start after installing Forefront TMG or when considering issues with TMG configuration.
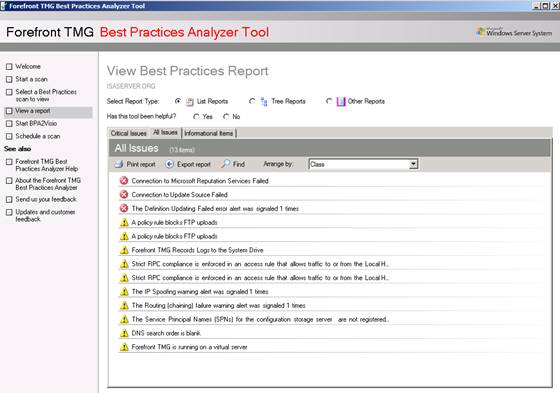 Figure 6: TMG BPA
Forefront TMG Data Packager
Forefront TMG Data Packager is a useful tool for collecting necessary information about Forefront TMG configuration. You can use Data Packager to send information to Microsoft product support centers for more in-depth analysis, but you can also use this tool to record Forefront TMG installation status.
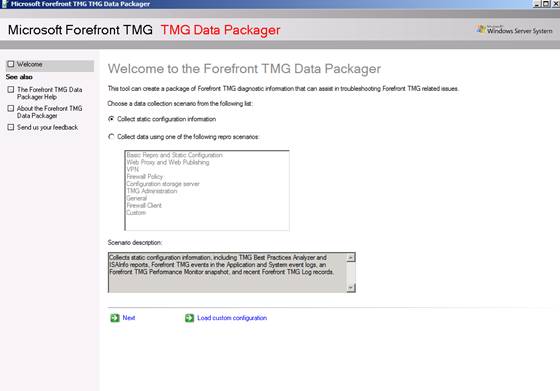 Figure 7: TMG Data packager
The tool also allows you to specify the data you want to be part of the TMG Data Packager collection process.
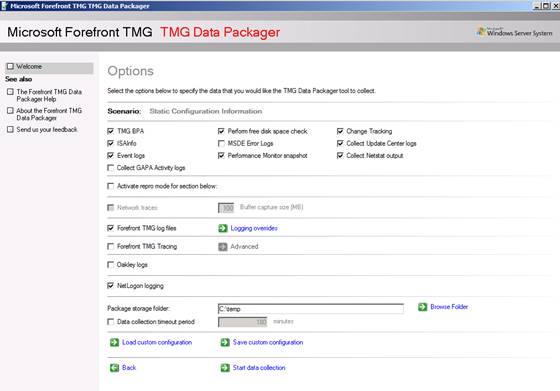 Figure 8: TMG Data packager - Options
TMG Data Packager will create a CAB file with lots of information as you can see in the picture below.
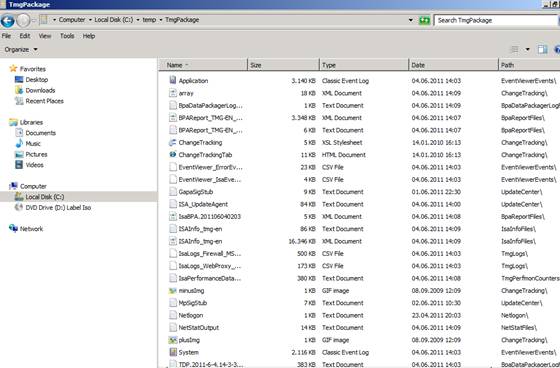 Figure 9: Content of CAB file
Netsh
Starting with Forefront TMG, Microsoft extended the Windows Netsh tool with some Forefront TMG commands. Some commands of FWENGMON utility of ISA Server 2006 are now part of Netsh. Netsh now has many options for showing you the client connections with the firewall at a low level and this is useful in some situations.
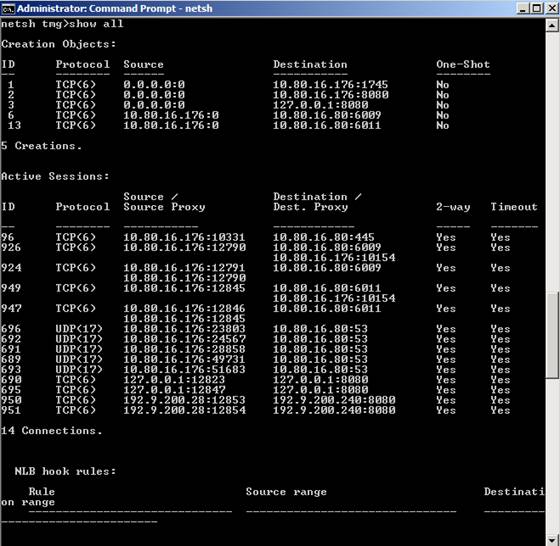 Figure 10: NETSH TMG options
Microsoft Network Monitor (Netmon)
The last tool I want to talk about is Microsoft Network Monitor (Netmon), you can use this tool to delve deeper into network traffic. Netmon is very useful when you can't find the cause of the problem with the tools available in Forefront TMG. You can use Microsoft Network Monitor version (Netmon) 3.3, part of TMG BPA installation or you can use the latest version 3.4 from Microsoft's website.
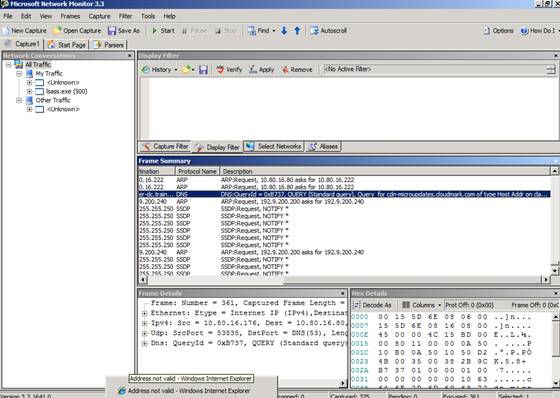 Figure 11: Microsoft Network Monitor
Note:
If you want to analyze network traffic between Forefront TMG and ISA Firewall clients, you can use the Netmon Parser tool.
Troubleshooting Forefront TMG
Forefront TMG Management console includes several troubleshooting tools such as the Traffic simulator, change monitoring tool and connectivity test tool.
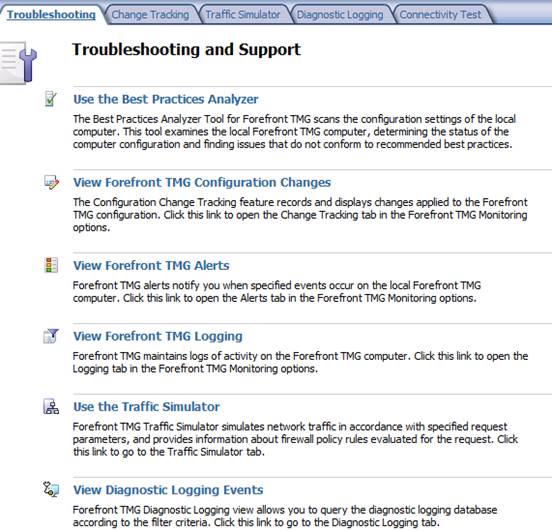 Figure 12: Forefront TMG troubleshooting and support
In troubleshooting TMG, the TMG Diagnostic Logging feature is very useful in finding problems in TMG configuration. Forefront TMG Diagnostic Logging is not enabled by default, so if you want to use it you need to enable it manually.
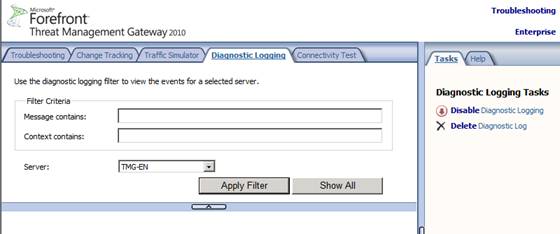 Figure 13: Forefront TMG Diagnostic logging
After the TMG Diagnostic logging is active, you can stop running and filter the log to find the information you are interested in.
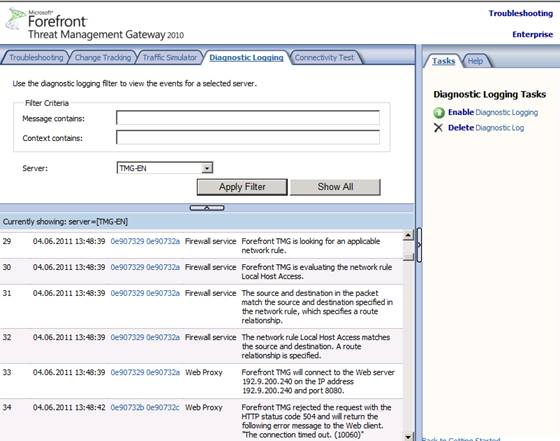 Figure 14: Forefront TMG Content Diagnostic logging
Diagnostic logging gives you more information about how Forefront TMG works.
FWENGTRACE
FWENGTRACE is part of the Forefront TMG Best Practice Analyzer and it is used to change monitoring information for some Forefront TMG components, in this example the Forefront TMG Forefront TMG (Large Logging Queue) feature.
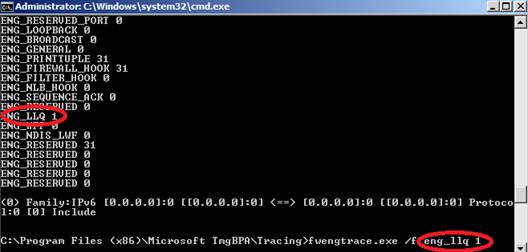 Figure 15: FWENGTRACE
ISATRACE
Like Forefront UAG, Forefront TMG has several monitoring features that allow you to change the contents of the ISALOG. BIN monitoring file located in the% windir% Debug folder. Starting from ISA Server 2004 SP2 the ISALOG. BIN file is used to monitor the status of many Forefront TMG components. With ISATRACE, you can change the information in the monitoring file.
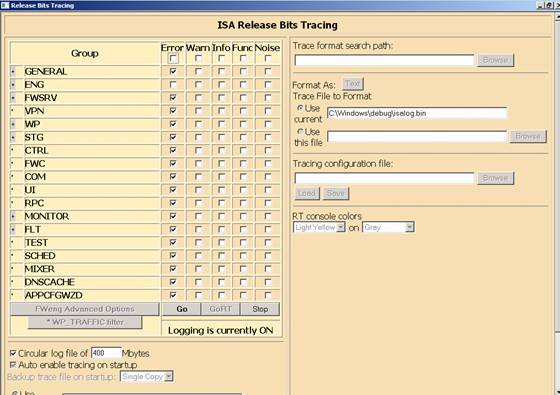 Figure 16: ISATRACE
Windows Performance Monitor (Perfmon)
Perfmon is a great utility in analyzing the performance of Windows Server as well as applications installed on the server. Forefront TMG application contributes to extend the Windows Performance monitor utility with separate counters that Forefront TMG administrators can use to build TMG Server boundaries, then compare with existing payload boundaries. Act to get good performance with the TMG Server.
 Figure 17: Windows Perfmon with TMG counters
Because there are many performance counters for Forefront TMG subsystems and it can take a long time to find the right counter, so Microsoft developed PAL (Performance Analysis of Logs) to create XML files for Specific applications have performance counters. You can use these XML files to import it into the Perfmon tool.
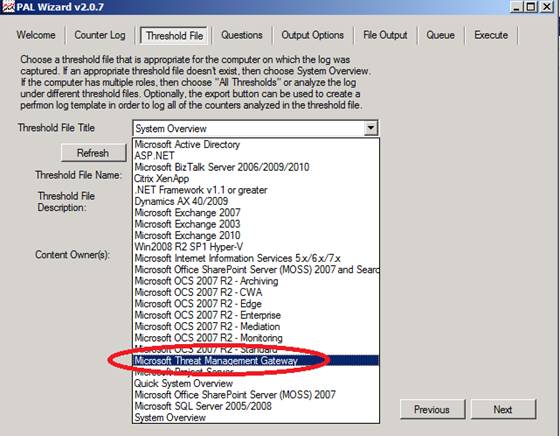 Figure 18: PAL form
Export PAL XML file to Perfmon's sample file. In Windows Performance monitor, navigate to Data Collector Sets and create a new Data Collector Set.
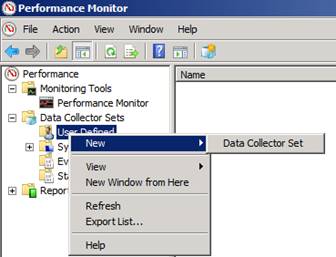 Figure 19: Create a new Data Collectore Set with Perfmon
Select 'Create from a template'. Select the XML sample file from PAL, now you can see performance counters for Forefront TMG.
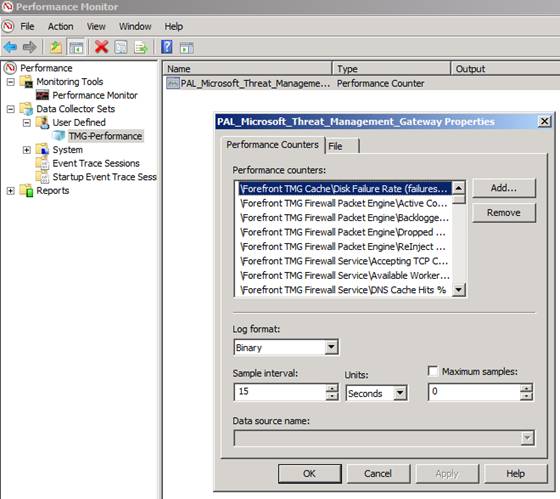 Figure 20: Perfmon with PAL counters
You can use the Data Collector Set to start collecting information. Right-click on the new Data collection and select Start .
After you stop collecting data, you can view the collected data reports under the reports of the Windows Performance monitor.
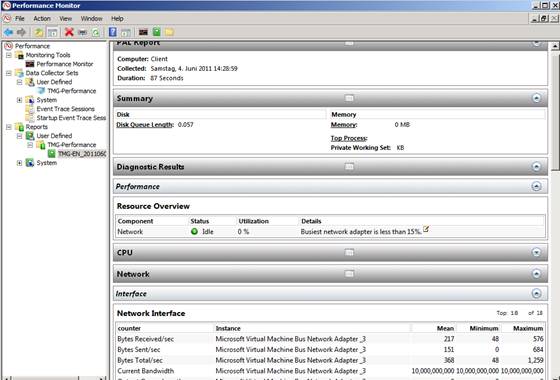 Figure 21: Report of Perfmon data collector
Forefront TMG SuperFlow application
At the end of this tutorial will introduce the Forrefront TMG Superflow application. You can use this tool to troubleshoot the failure of installing Forefront TMG. TMG Superflow contains many useful links and resources to troubleshoot a Forefront TMG installation error. You can refer here for this utility.
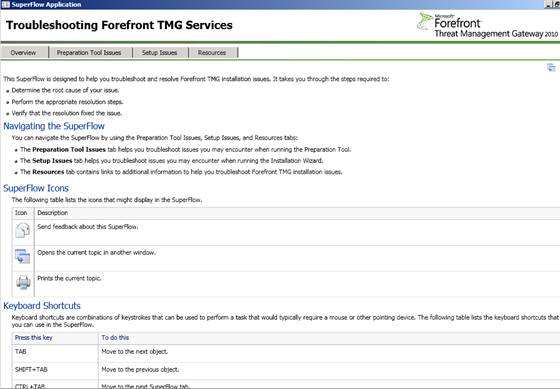 Figure 22: TMG Superflow
Conclude
Troubleshooting Forefront TMG can be complicated because there are so many reasons why Forefront TMG works as expected, but there are many troubleshooting tools and guides that can help you find it. cause the cause of the problem. In our opinion, the most important aspect is to have analytical methods when starting troubleshooting. You should always start with simple steps and gradually increase complexity if the previous analysis fails.
FAQ
What is Troubleshooting Forefront Tmg about?
It provides a structured overview of Forefront TMG, explains the main context, and highlights practical takeaways for readers.
Why does this topic matter?
Understanding the main concepts helps readers evaluate the issue, avoid common mistakes, and make better-informed decisions.
How should readers use this information?
Use the guidance as a practical starting point, confirm details that may have changed, and follow current product, safety, or security recommendations.
Related Articles
 Microsoft Forefront Tmg -- Forefront Tmg Sdk10 minutes read
 Forefront AI Explained12 minutes read
 Forefront Tmg Beta 3 Isp Redundancy Mode6 minutes read
 Microsoft Forefront TMG - TMG Storage 1018 minutes read
 Microsoft Forefront Tmg -- Use Network Template8 minutes read
 Microsoft Forefront TMG - Backup and Restore Capabilities9 minutes read
Reader Comments 0
Sign in with email or Google to join the discussion.