Table of Contents
Infography provides a workflow for turning a webpage URL into an infographic draft. Paste the article link, choose an output size, generate the design, and edit it before downloading. Treat the result as a visual summary: it may omit details or misrepresent the page, so compare it with the original before sharing.
1. Sign in and prepare the source
Open the Infography app and use an available sign-in option. The source screenshots show Google sign-in; account options and usage limits may differ.
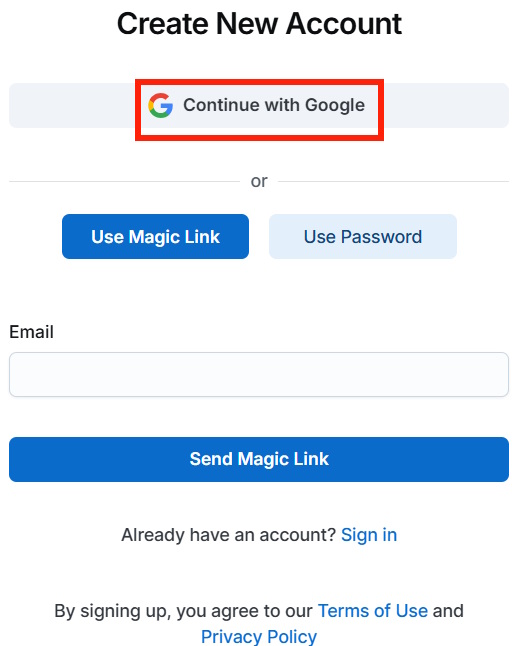
Choose one focused article that you are allowed to reuse. Read it first and identify the main message, supporting points, and any qualifications that must survive the summary. A very long page may need more than one graphic.
2. Paste the webpage URL and choose a size
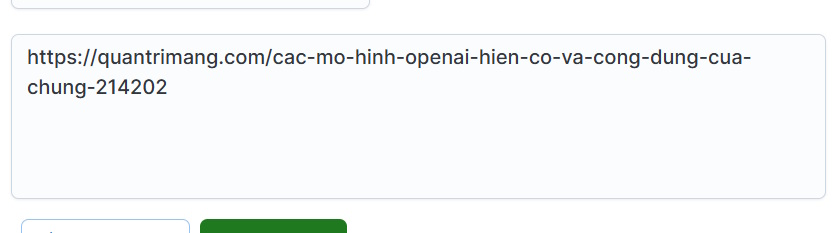
Paste the full article URL into the URL input shown in the source workflow.
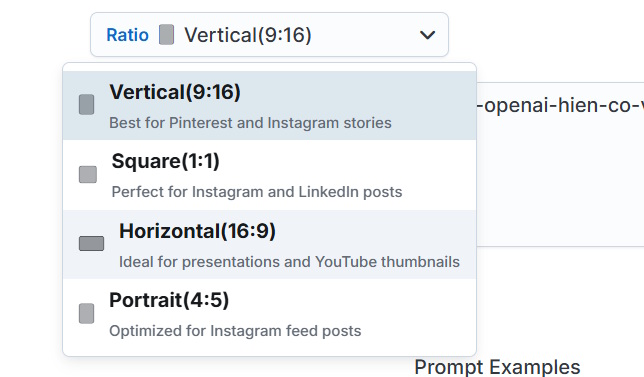
Select a size appropriate for the destination. A tall infographic can suit an article, while another layout may be easier to read on a presentation slide. Do not fit more text by shrinking it until it becomes illegible.
If the service cannot read the page, check that the URL is correct and the article is accessible. Do not assume a generated result contains the page's content merely because generation completed.
3. Generate and check the draft
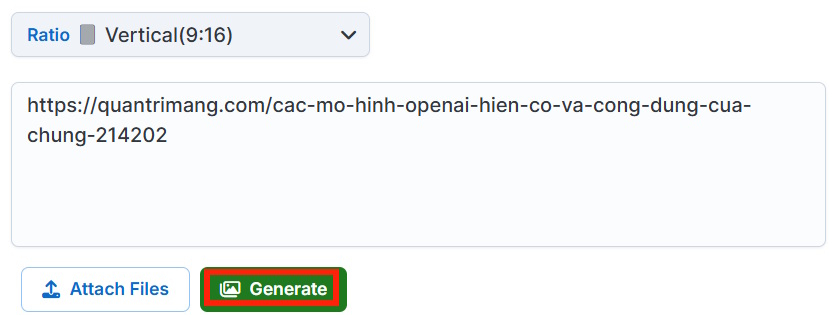
Select Generate and wait for the result.
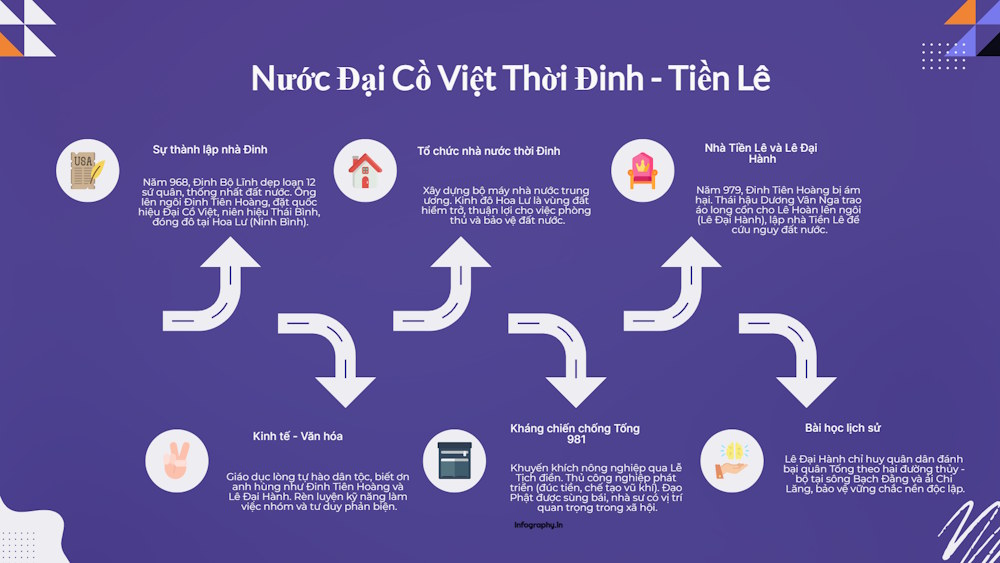
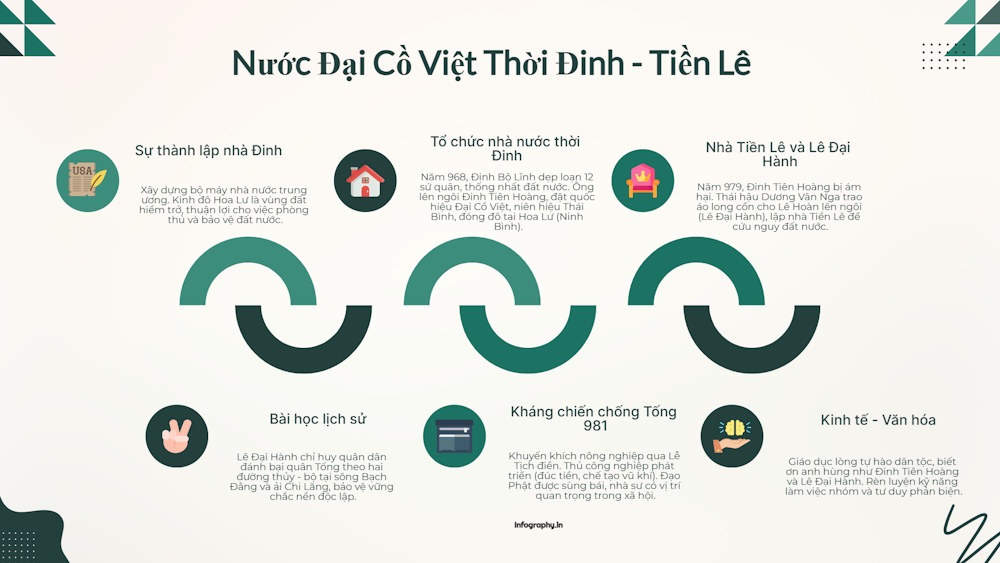
The following gallery shows example output from the original workflow.
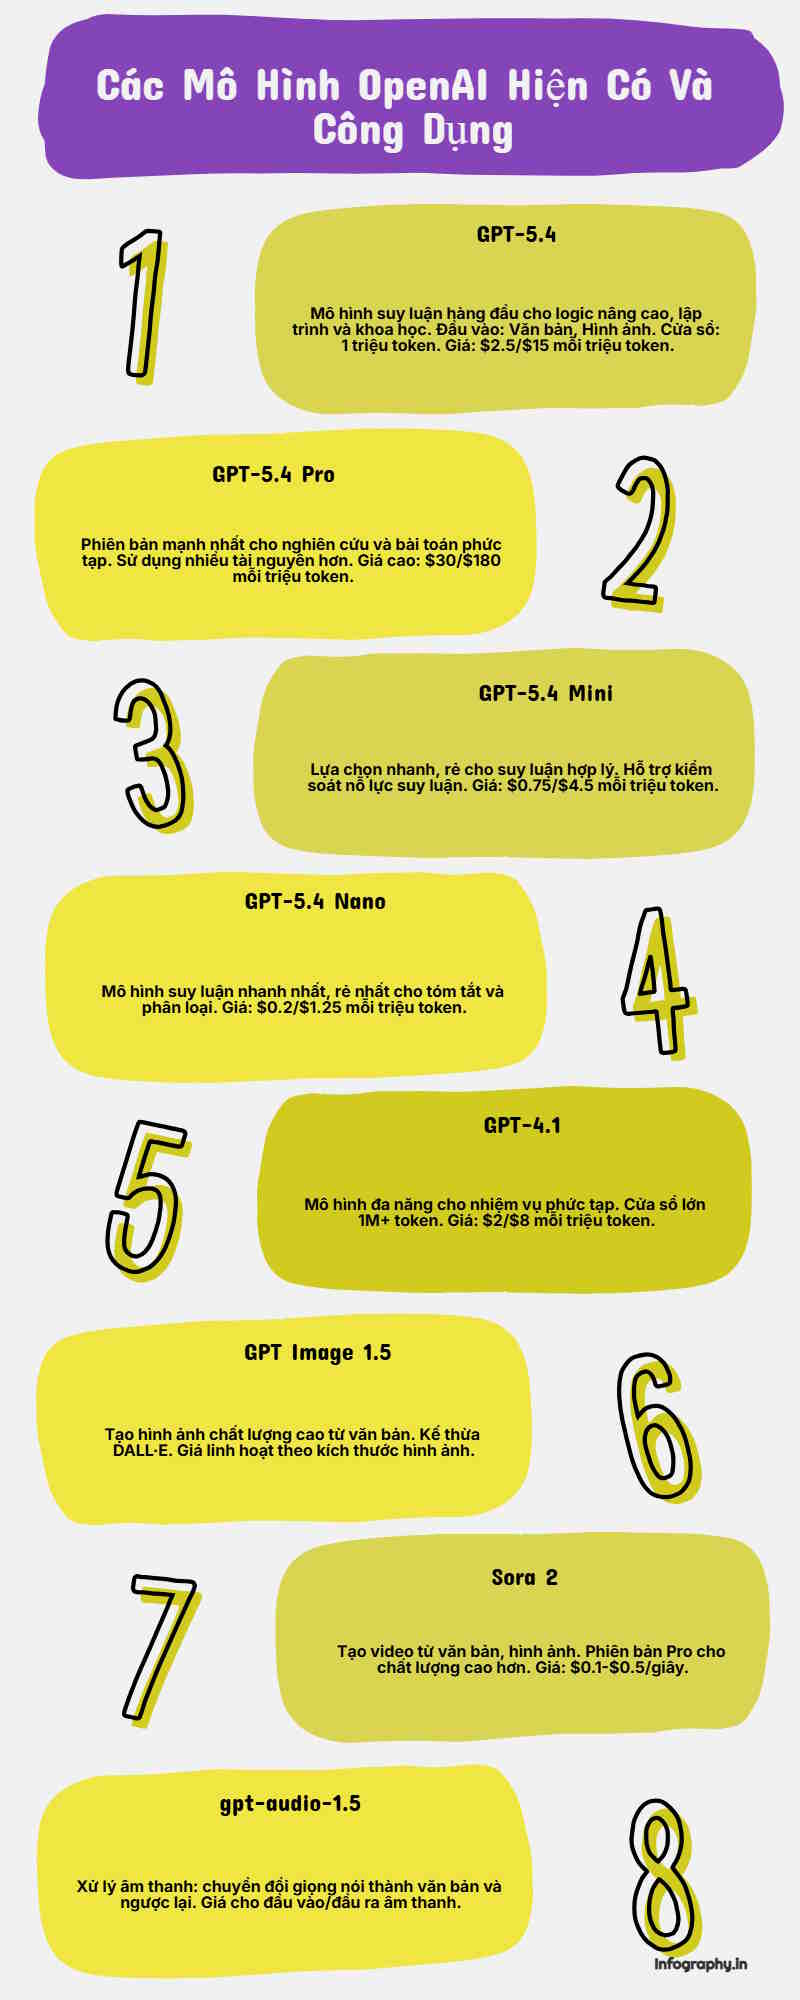
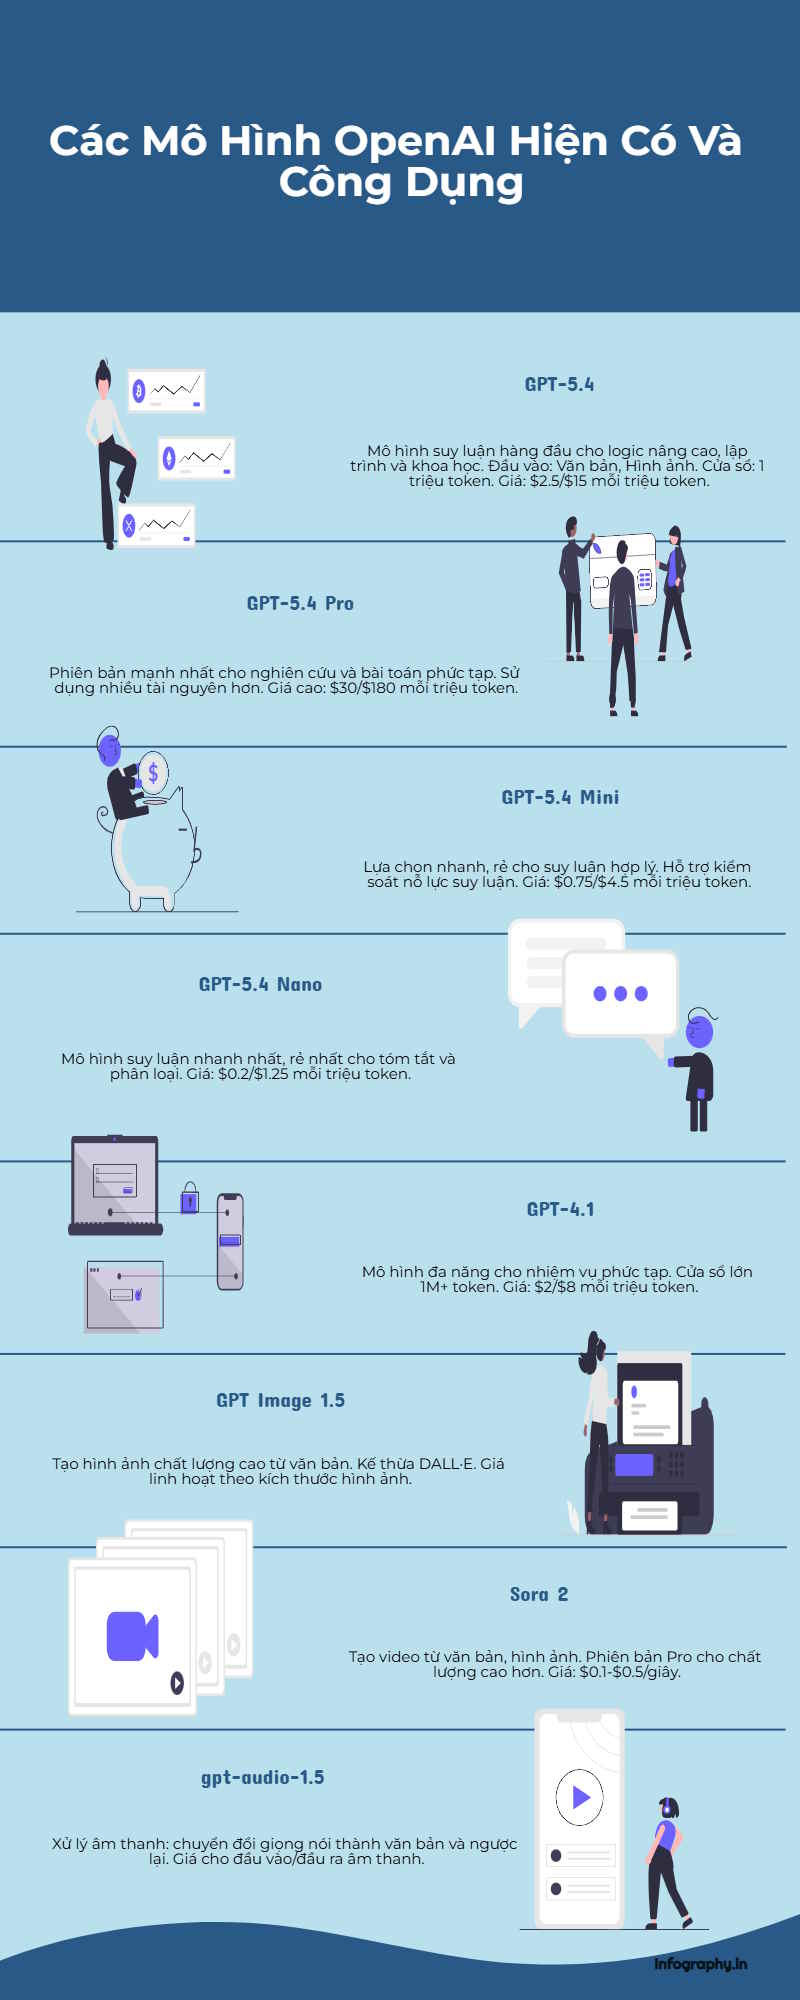
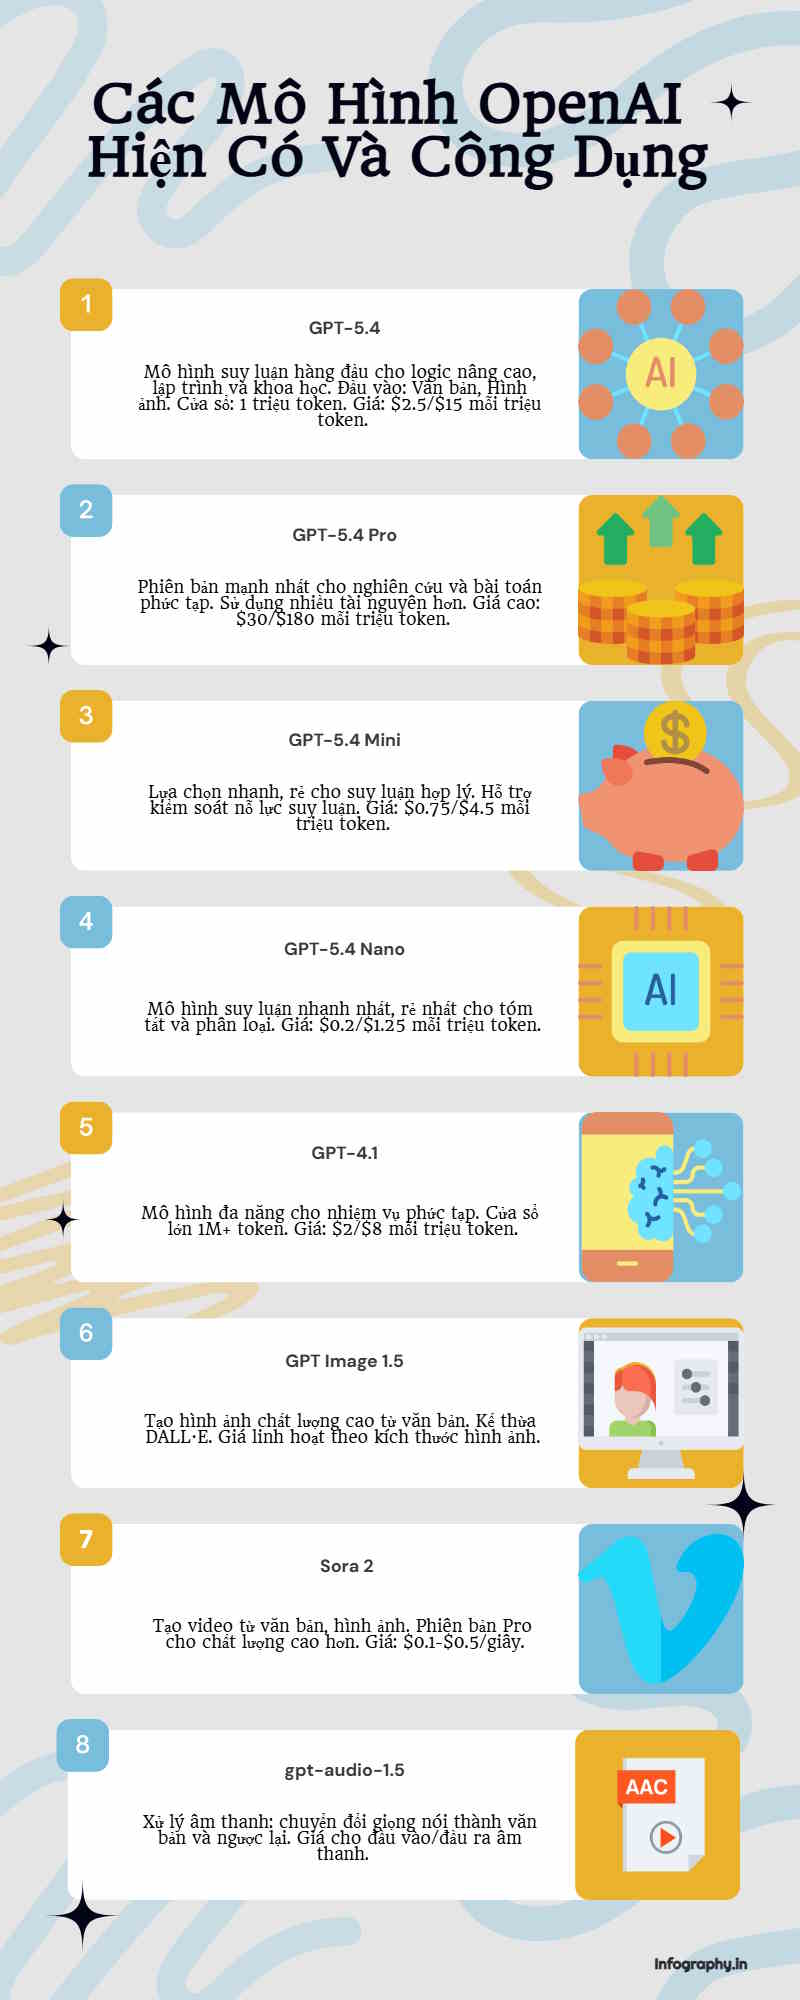
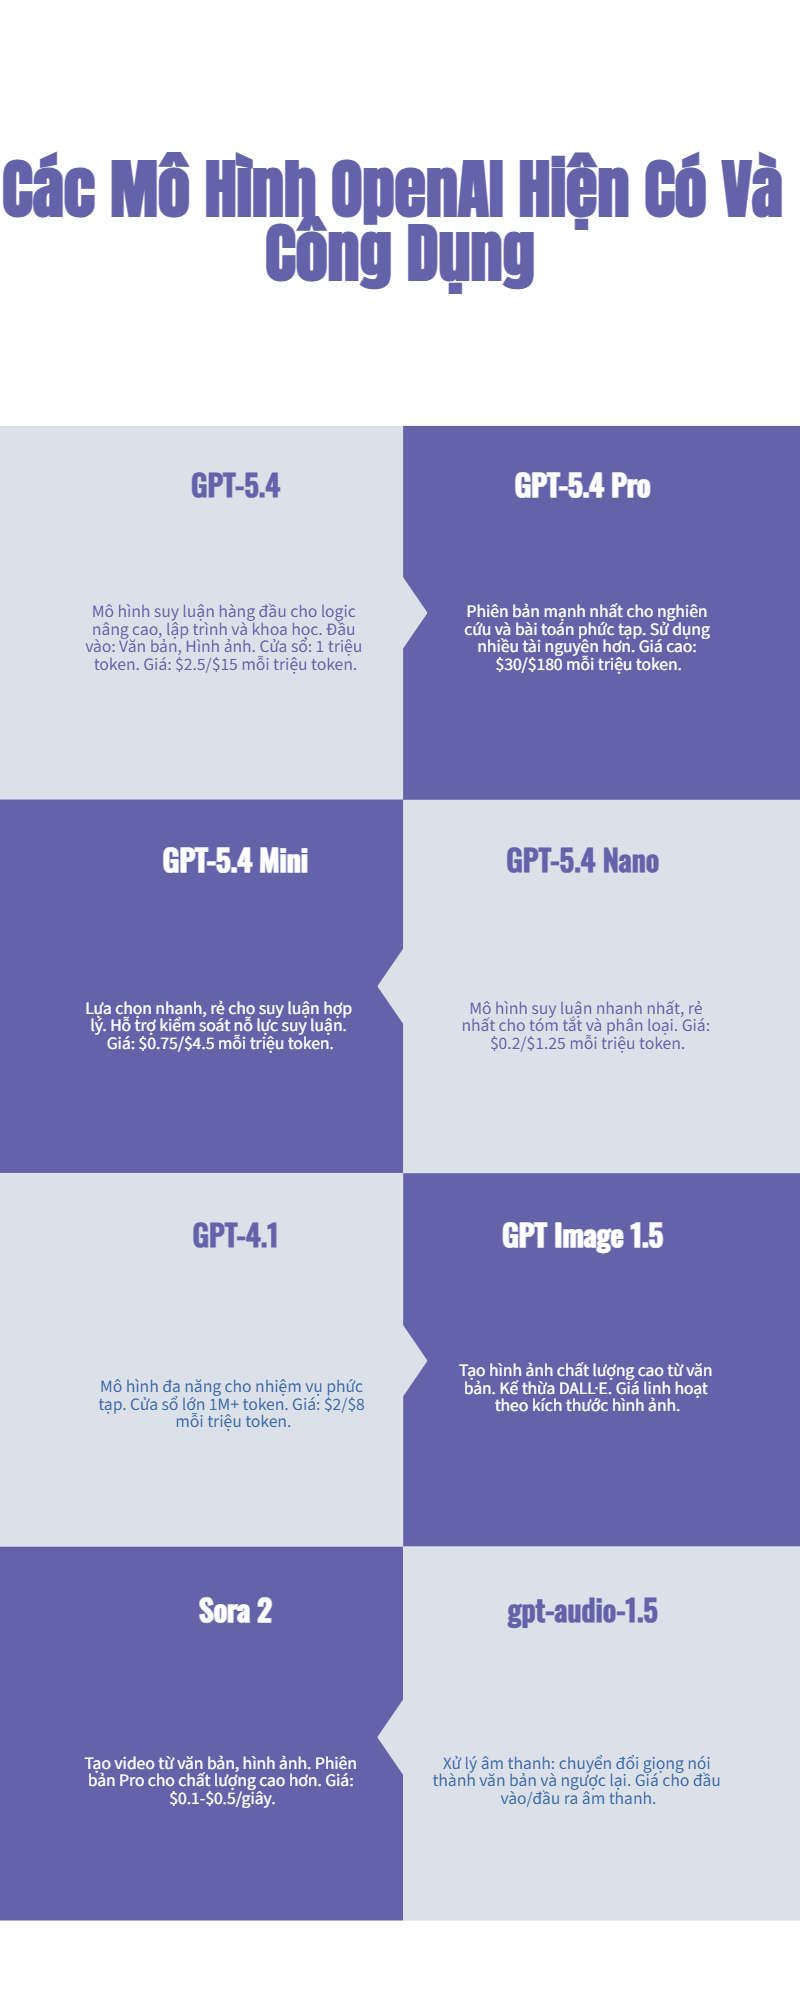
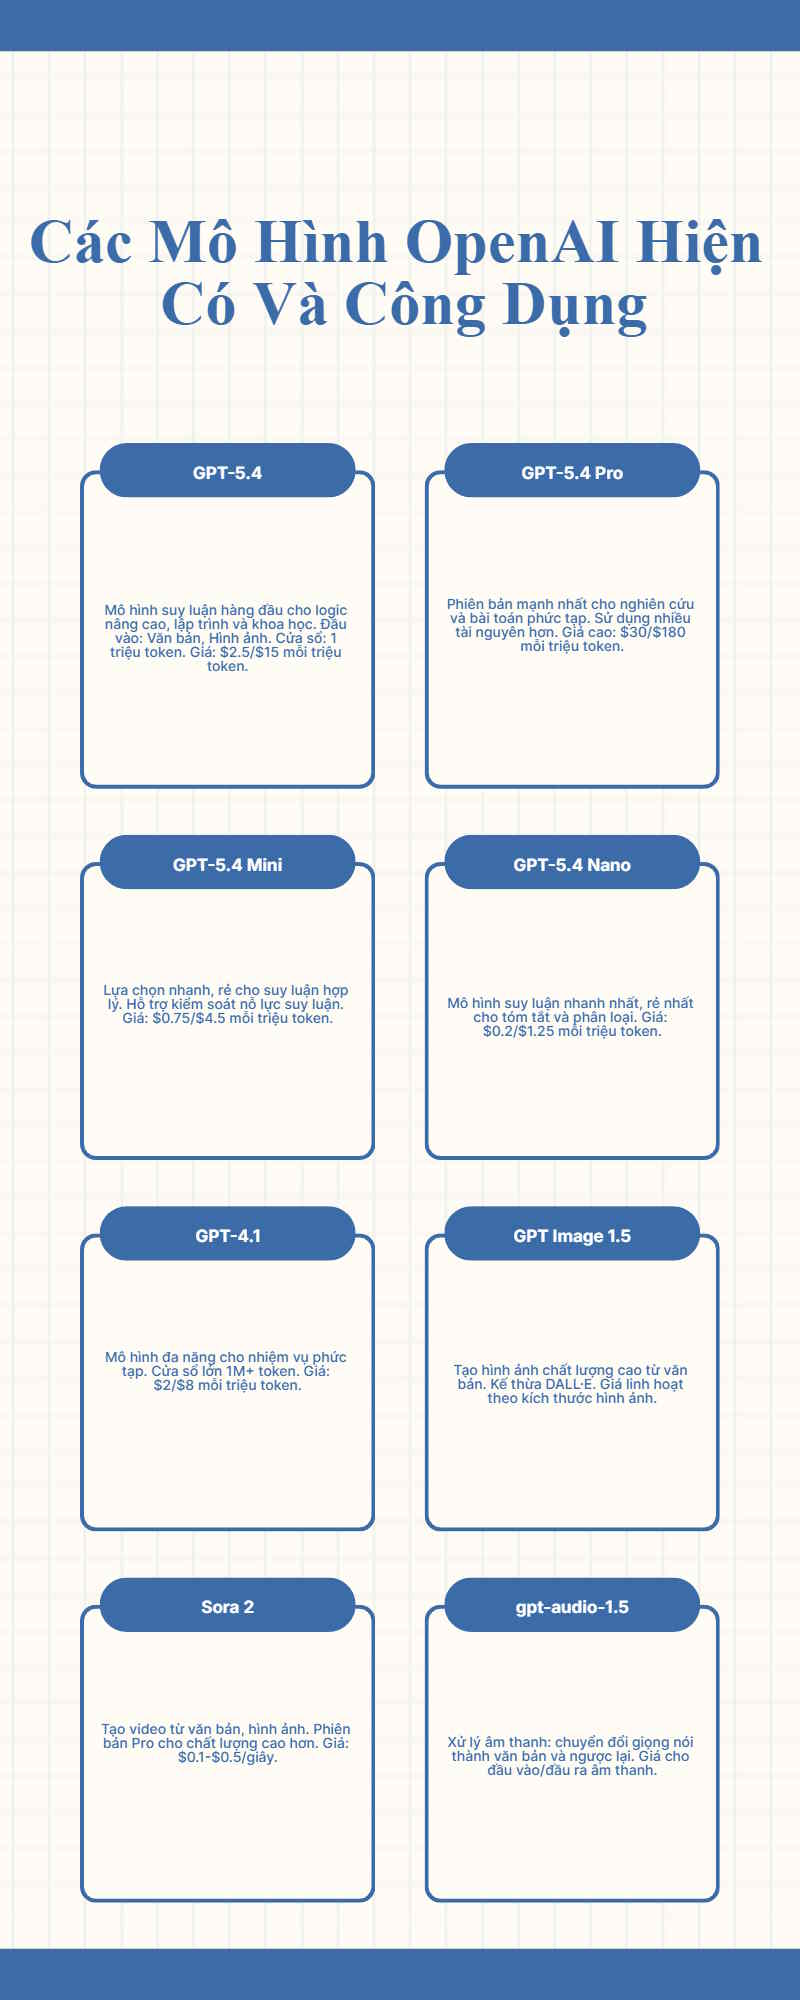
Compare each section with the webpage. Verify names, dates, numbers, units, and causal claims. Check that icons and illustrations support the meaning rather than imply something the source never says. If a numerical chart appears, confirm that its labels and proportions match the actual data.
4. Edit before downloading
Use Edit on the generated page to adjust content or formatting. The source interface also includes a Download control.
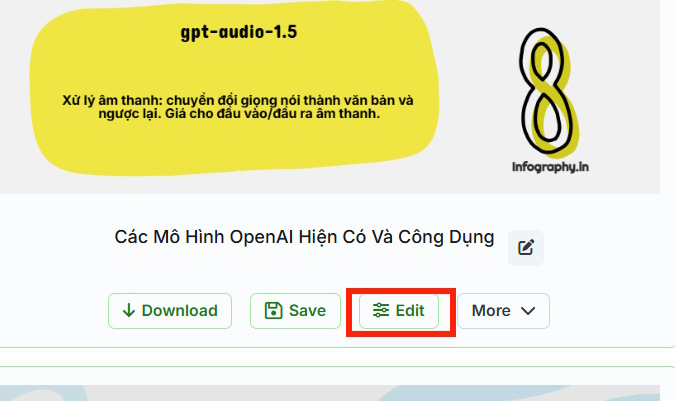
Correct factual errors first, then improve readability: shorten crowded text, make headings clear, use consistent spacing, and preserve important exceptions. Include a source reference where practical, particularly for figures or research claims.
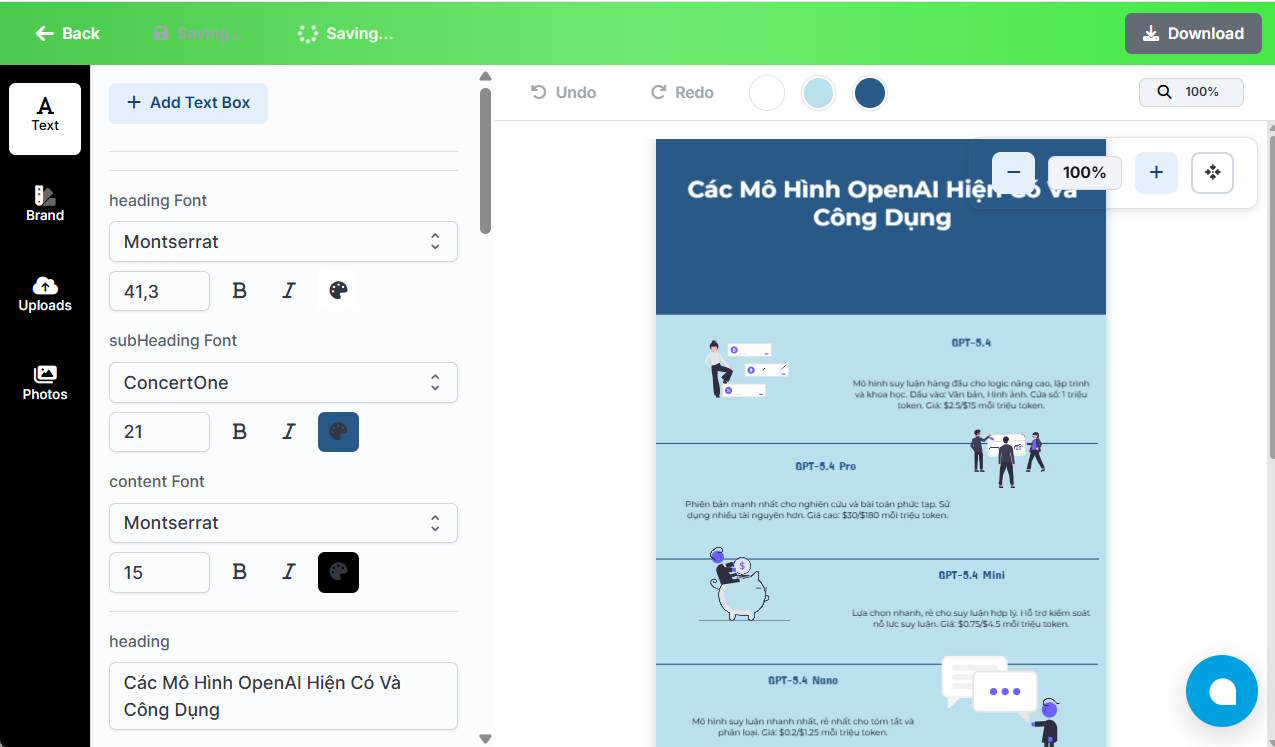
After editing, download the result and open the exported file. Check for clipped text, missing characters, unreadable labels, and unexpected page breaks at the size your audience will see.
Create from a prompt when you need tighter scope
The source workflow also shows prompt-based creation. Where that option is available, provide the verified content and explicit design instructions.
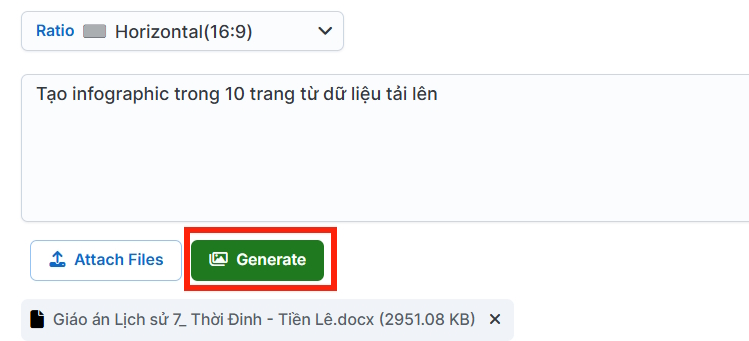
Create an infographic for beginners using only the supplied text. Use one title and four short sections. Preserve all numbers and qualifications. Do not add statistics or claims. Include the source title and URL in a readable footer.
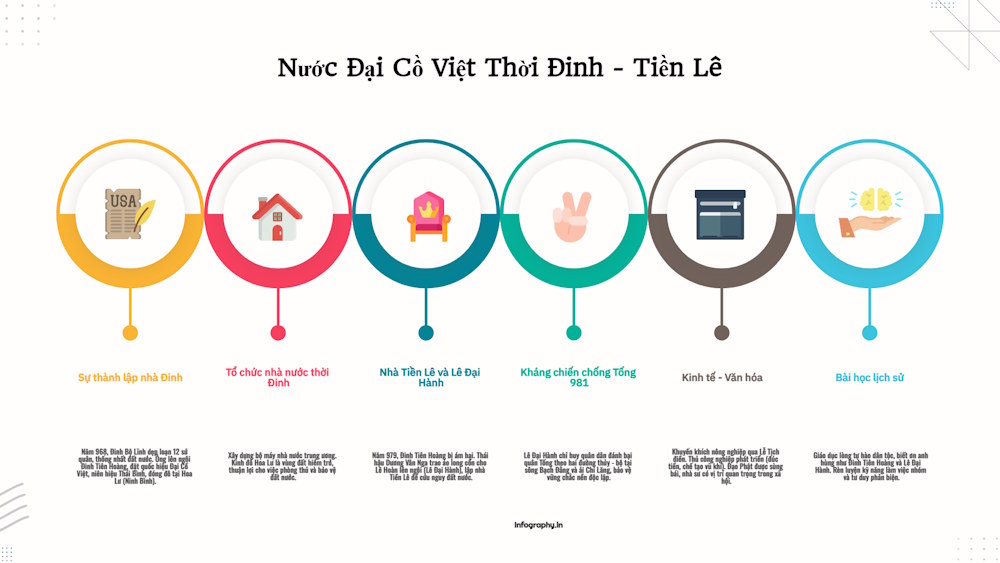
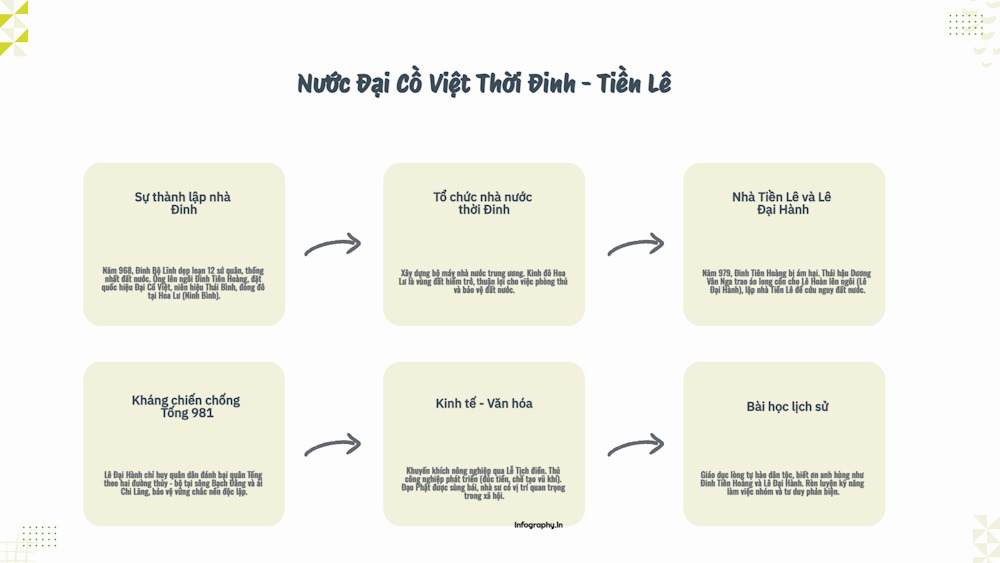
This gives the tool a defined content boundary, but does not eliminate the need to proofread. The examples below show the original prompt-based output.

When publishing an infographic on a webpage, keep a text explanation available alongside the image so readers can access the information without relying on small embedded text.
Related Articles
 Want to Create a Perfect Infographic, Please Refer to This Advice4 minutes read
 5 Infographics Tricks for Beginners to Marketing6 minutes read
 11 Free Tools That Support Creating Simple Infographic13 minutes read
 Xmlhttp: How to Program in Ajax6 minutes read
 Steps to Create an Infographic on Canva7 minutes read
 How to Create Professional Infographic by Piktochart6 minutes read
Reader Comments 0
Sign in with email or Google to join the discussion.