Table of Contents
This updated guide explains how to Use TREND - FORECAST Function through clear steps, practical examples, and important checks that help prevent common errors.
1. TREND Function
a) Description
- The function returns values in a linear trend in Excel
b) Syntax
= TREND (known_y's, [known_x's], [new_x's], [const])
Arguments
- known_y's: The set of known y values in the relationship y = b * m ^ x, is a required parameter.
+ If known_y's is in a single column or row -> each known_y's column or row is interpreted as a separate variable.
- known_x's: The set of known x values in the relationship y = b * m ^ x, is a required parameter.
+ known_x's may include 1 or more sets of variables.
+ If known_x's is omitted -> it is assumed to be an array of the same size as known_y's
- new_x's: Are the new x values that you want the function to return the values corresponding to the values of y.
+ new_x's must include a column (row) for each independent variable.
+ If new_x's is omitted -> it is assumed to be the same as known_x's.
+ If known_x's and new_x's are omitted -> it is assumed to be the same as known_y's size.
- const: The logical value determining the value of the constant b, is an optional value including the following values:
+ const = True or ignore -> b is calculated normally.
+ const = False or ignore -> b = 1 and m are adjusted such that: y = m ^ x.
Important Notes
- The value of the returned formulas has the array formula type -> the function must be entered as an array formula.
- If known_y's ≤ 0 -> the function returns the #NUM! error value
- When entering values for an argument with the following convention:
+ Use commas to separate values in the same row.
+ Use semicolons separating between rows together.
this guide introduces you to the FORECAST function - one of the functions in the statistical function group is very popular in Excel.
c) Example
Revenue estimates for June, July and August are based on previous months as described in the following data table:

- in the target cell enter the formula: = TREND (D5: D10, C5: C10)

- Press Enter -> return value is:

- Highlight the sales areas in June, July and August (D11: D13 areas) -> press F2:
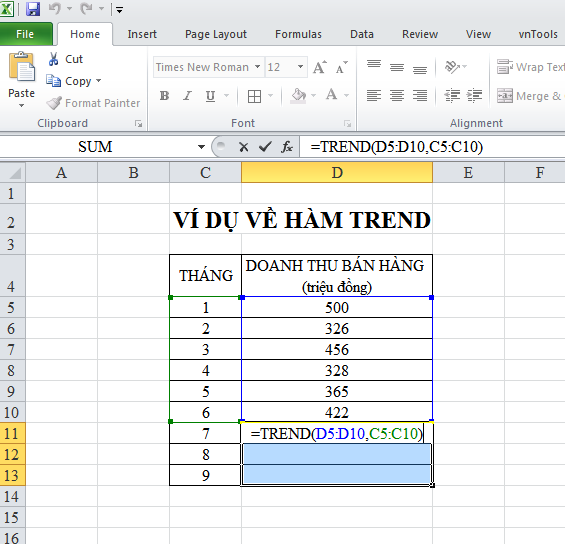
- Press the key combination Ctrl + Shift + Enter -> estimated revenue for June, July and August is:
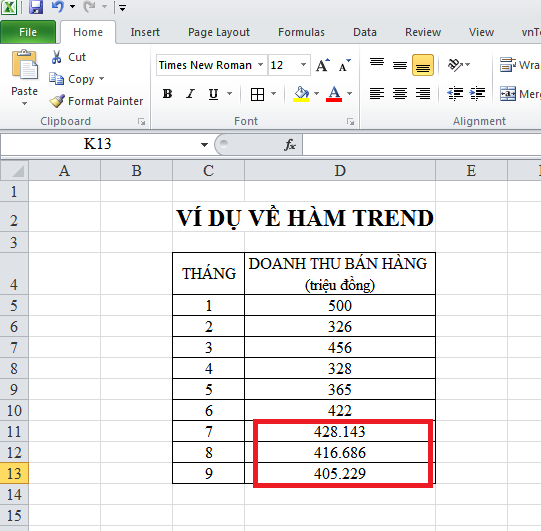
2. FORECAST Function
a) Description
The function performs a calculation or prediction of a future value by using current values using linear regression. In Excel 2016 this function is replaced by FORECAST. LINEAR function.
b) Syntax
= FORECAST (x, known_y's, known_x's)
Arguments
- x: Data point to predict a value for it, is a required parameter.
- known_y's: Dependent array of an array or range of data.
- known_x's: Independent array of array or range of data.
Important Notes
- If x is not a number -> the function returns the #VALUE! error value.
- If known_y's or known_x's are empty or contain a different number of data points -> the function returns the #N/A error value
- If known_x's = 0 -> variance, the function returns the DIV / 0 error value!
- FORECAST transform equation is: A + BX where:
And x, y are the average samples of AVERAGE (known_x's) and AVERAGE (known y's).
c) Example
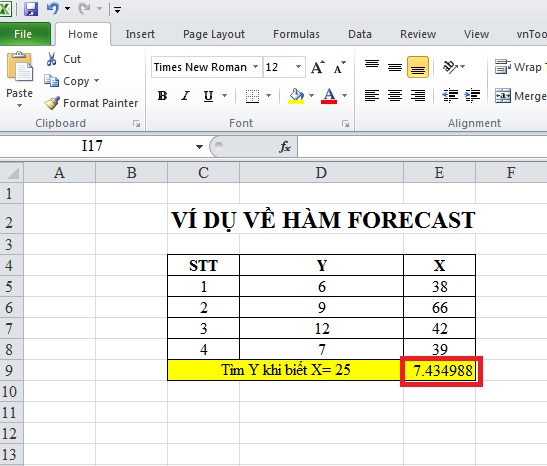
Find the predicted value of y and the value of x is 25
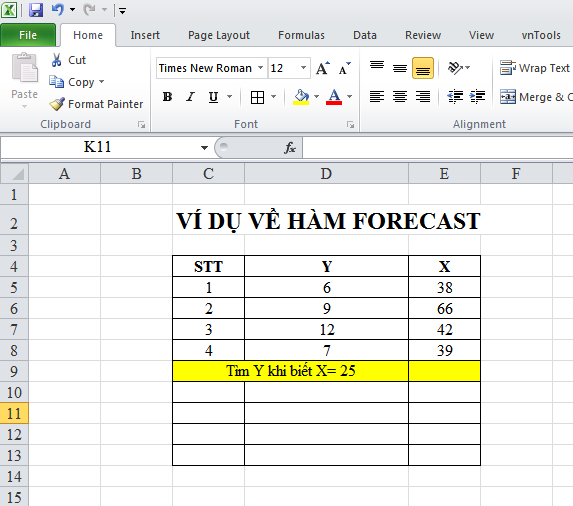
- Predict the value of y and the value of x is 25. in the target cell enter the formula: = FORECAST (25, D5: C8, E5: E8)
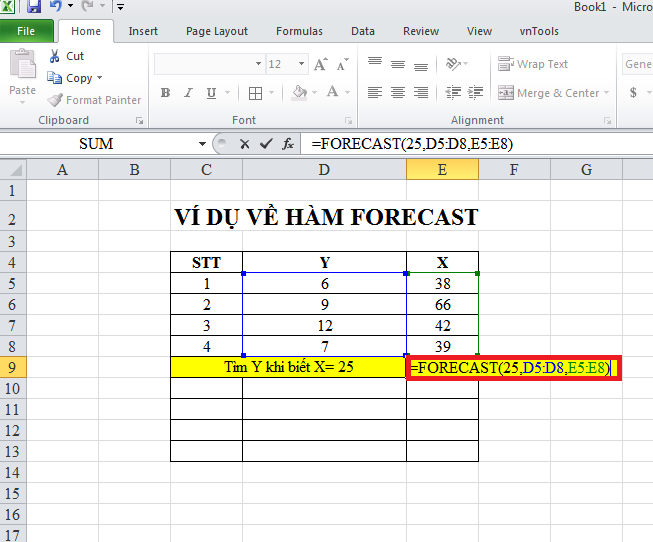
- Press Enter -> Predict the value of y is:
FAQ
What is the easiest way to Use TREND - FORECAST Function?
Start with the requirements in this guide, then follow each step in order. Check the result after every major change so problems are easier to identify.
Can beginners follow these instructions?
Yes. The process is organized into practical steps, and you can repeat any step before moving forward.
What should I check if the method does not work?
Confirm your software or device version, permissions, settings, file format, and internet connection when the task depends on online services.
Related Articles
 How to Use the FORECAST Function in Excel3 minutes read
 Use the TREND Function in Excel: Step-by-Step Guide6 minutes read
 TREND - the Function Returns Values in a Linear Trend in Excel4 minutes read
 Download Weather Forecast Pro, the 83,000 VND Real-time Weather3 minutes read
 How to Use the WEIBULL Function in Excel3 minutes read
 View Weather Forecast on Windows 10 Computer4 minutes read
Reader Comments 0
Sign in with email or Google to join the discussion.