How to use CONSOLIDATE to statistic, combine data in Excel

CONSOLIDATE is one of Excel's useful data statistics tools. CONSOLIDATE allows you to quickly perform sum, average, maximum value, minimum value . Software Tips invite you to refer to the following article information to better understand the syntax and usage CONSOLIDATE tool!

How to use CONSOLIDATE to statistic, combine data in Excel Picture 1

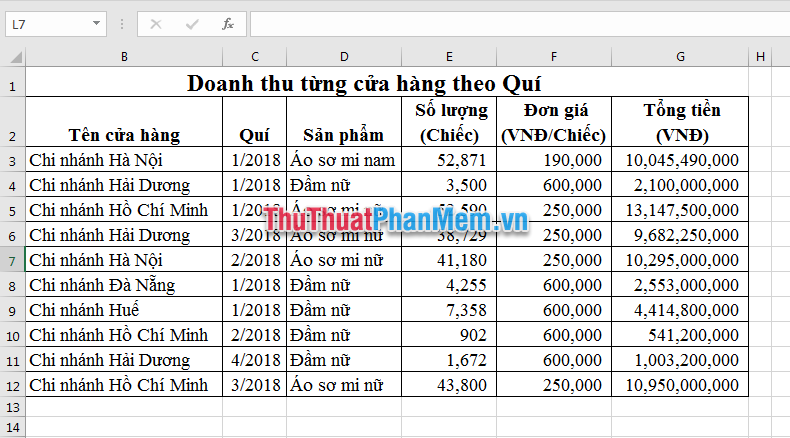
In the spreadsheet below, a detailed list of data by location and time, your task is to synthesize into summary reports according to each report criteria.

How to use CONSOLIDATE to statistic, combine data in Excel Picture 2

Step 1: Put your cursor in a cell where you want to return the report. For example, cell J2 . Select the Data tab (1) => Click on the icon of CONSOLIDATE (2) .

How to use CONSOLIDATE to statistic, combine data in Excel Picture 3

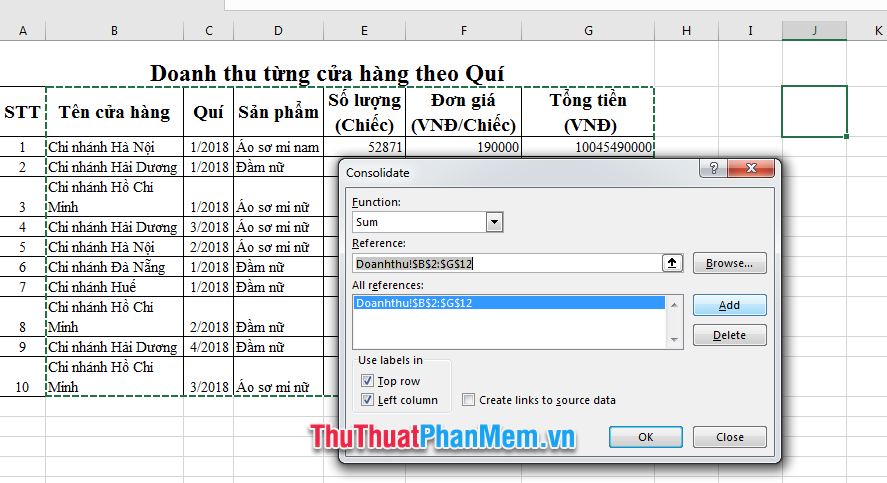
Step 2: The CONSOLIDATE window appears.

Inside:

  1. Function: Select the function to perform calculations like Sum (sum), Count (count data), Average (average), Max, Min .

How to use CONSOLIDATE to statistic, combine data in Excel Picture 4

  1. Reference : The position of the data area to be referenced. To select a range of calculations, click the Reference box and then drag to select the range.

How to use CONSOLIDATE to statistic, combine data in Excel Picture 5

  1. After scanning the Reference area, click the Add button to include the reference address in the All Reference .

How to use CONSOLIDATE to statistic, combine data in Excel Picture 6

  1. Top row: Headline. If the first line is the title you choose this check box.
  2. Left column: In the column header, if the first column of the data range is the header you select this check box.
    In this step, Software Tips will select the Sum function, the reference region from B2: G12, and all choose the headline and column header products.

How to use CONSOLIDATE to statistic, combine data in Excel Picture 7

Step 3: Click the OK button to view the summary report. The resulting report will return starting in cell J2 as you selected in Step 1 .

How to use CONSOLIDATE to statistic, combine data in Excel Picture 8

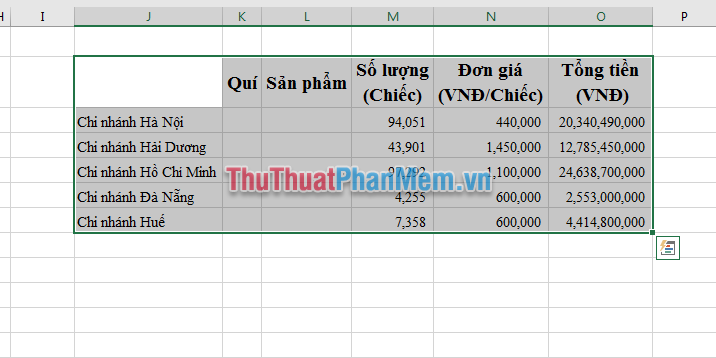
The CONSOLIDATE result adds up the column cells in the data table according to the criteria of the first column you select as the header column. In the Quarter and Products columns cannot add up, so the result is equal to 0. The Unit Price column has no meaning so you can delete it.

Above Software Tips guide you to use the CONSOLIDATE tool to collect statistics in Excel. Good luck!

4 ★ | 1 Vote

May be interested

  • Windows and Windows Phone software repositories will mergeWindows and Windows Phone software repositories will merge
    the windows store can operate similarly to apple's app store when the tablet can run applications for phones.
  • Familiarize yourself with PivotTable reports in ExcelFamiliarize yourself with PivotTable reports in Excel
    familiarize yourself with pivottable reports in excel. what are pivottable reports? - pivottable reports are the most useful feature of excel that helps you to statistic data according to many different criteria. from there, you save time and effort to produce a spending report
  • How to automate Vlookup with Excel VBAHow to automate Vlookup with Excel VBA
    vlookup is an essential function in excel and has become an important part of data processing. it provides a number of functions that you can combine with a comprehensive database.
  • How to create 2 Excel charts on the same imageHow to create 2 Excel charts on the same image
    the combination of 2 charts on the same excel image helps users easily show the data.
  • Summary of 50 Excel shortcuts you should know by 2023Summary of 50 Excel shortcuts you should know by 2023
    microsoft excel is widely used globally for data storage and analysis. although there are many new data analysis tools on the market, excel is still the go-to product for working with data. it has many built-in features, making it easier for you to organize your data.
  • How to create duplicate data entry notifications on ExcelHow to create duplicate data entry notifications on Excel
    data validation on excel is a feature that helps create notifications when users enter data incorrectly with established rules. so how to create duplicate data message on excel?
  • How to import data from photos into ExcelHow to import data from photos into Excel
    on the office 365 version, users can already import data from photos into excel for immediate use without having to find some data extraction tools from photos. users can extract data from photos into excel with saved images or from screenshots.
  • How to limit the value entered by Data Validation ExcelHow to limit the value entered by Data Validation Excel
    data validation on excel is a feature that will help users create data entry limits on excel. when entering that limit number you will receive a notification.
  • MS Excel 2007 - Lesson 8: Sort and FilterMS Excel 2007 - Lesson 8: Sort and Filter
    sort and filter are features that allow you to manipulate data in a spreadsheet based on standards. to sort data and filter data in excel 2007 you will use the sort & filter feature. below tipsmake.com will guide you how to filter data, arrange data with this feature in excel 2007.
  • How to get data from web into ExcelHow to get data from web into Excel
    excel has a feature to get data from the web into excel, such as a price list, and can automatically update the data for the table according to the source data.