How to implement T-Test in Excel
T-Test is a way to decide whether there is any statistically significant difference between data sets, using Student t distribution. T-Test in Excel is to compare the average value of two samples. This article explains what statistical significance means and shows how to implement T-Test in Excel.
Note : The instructions in this article apply to Excel 2019, 2016, 2013, 2010, 2007; Excel for Office 365 and Excel Online.
Instructions for implementing T-Test in Excel
- What is statistical significance?
- Why check statistical significance?
- What is Student t distribution?
- How to implement T-Test in Excel
- Check and download add-in Analysis Toolpak
- Perform F-test and T-test in Excel
What is statistical significance?
Suppose you want to know which dice of the two will score higher. You roll the first dice and get 2 points. Then you roll the 2nd dice and get 6 points. Does this tell you the second dice usually scores higher? If your answer is 'of course not', then you have a certain understanding of statistical significance. You understand the difference because of a random change in score every time a dice are rolled. Because the sample is very small (there is only one roll of the dice), it doesn't show anything significant.
Now imagine you roll each dice 6 times:
- The first dice give the numbers 3, 6, 6, 4, 3, 3. The average value is 4.17.
- The second dice give numbers 5, 6, 2, 5, 2, 4. The average value is 4.00.
Does this now prove that the first dice scored higher than the second one? Probably not. A sample with a difference in mean values makes the difference seem to still be due to random variables. When we increase the number of dice shakes, it will be difficult to give a normal answer to the question - the difference between the score is the result of a random change or is it really possible for this dice to give The point is higher than the other dice?
Significance is the probability in which the difference we observe between patterns is due to random variations. Significance is called alpha level or simply 'α'. Confidence , or simply 'c', is the probability that the difference between samples is not due to random variables. In other words, there is a difference between basic populations. Therefore: c = 1 - α.
You can put 'α' at any level you want, to feel confident about the level of significance demonstrated. The level of α = 5% (95% confidence level) is used frequently, but if you want to be really sure that any differences are not caused by random variables, you can apply the level of trust. higher reliability, use α = 1% or even α = 0.1% .
Various statistical tests are used to calculate reliability in different situations. T-Test is used to determine if the average number of two populations is different and the F-Test is used to determine if variances are different.
Why check statistical significance?
When comparing different things, you need to use meaningful test methods to determine if this is better than the other. This applies to many areas, for example:
- In business, people need to compare different products and marketing methods.
- In sports, people need to compare different devices, techniques and opponents.
- In engineering, people need to compare different design and parameter settings.
If you want to check if something works better than the other option in any field, you need to check the statistical significance.
What is Student t distribution?
Student t distribution is similar to normal distribution (also known as Gaussian). Both are bell-shaped with most results close to the average, but in rare cases, the results are quite far from the average in both directions, called the tail of the stool. coordination.
The exact shape of the Student t distribution depends on the sample size. For samples larger than 30, it is very similar to the normal distribution. As the sample size decreases, the tails will be larger, showing increased uncertainty from inference based on a small sample.
How to implement T-Test in Excel
Before you can apply T-test to determine if there is a statistically significant difference between the average of the two samples, you must first perform the F-Test. This is because different calculations are made for T-Test depending on whether there are significant differences between the variances.
Note : You will need the add-in Analysis Toolpak enabled to perform this analysis.
Check and download add-in Analysis Toolpak
To check and enable Analysis Toolpak, follow these steps:
1. Select the FILE tab > Options .
2. In the Options dialog box , select Add-Ins from the tabs on the left.
3. At the bottom of the window, select the Manage drop-down menu , then select Excel Add-ins, and then click Go.
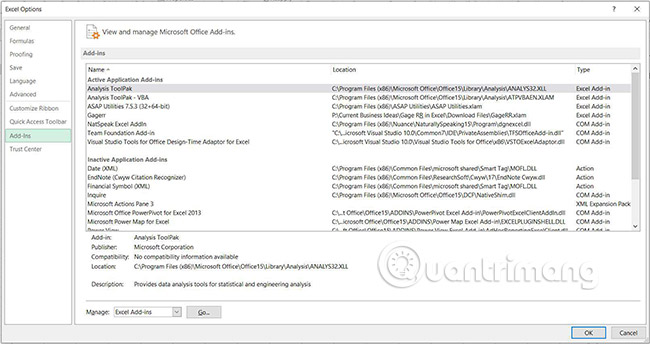
4. Make sure the check box next to Analysis Toolpak is selected, then click OK.
5. Analysis Toolpak is currently active. You are ready to apply F-Test and T-Test.
Perform F-test and T-test in Excel
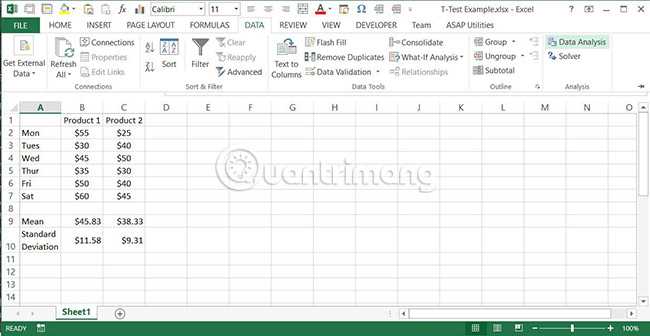
1. Enter two sets of data into a spreadsheet. In this case, for example, consider selling two products in a week. The average daily sales value for each product is also calculated, along with its standard deviation.

2. Select the Data> Data Analysis tab.
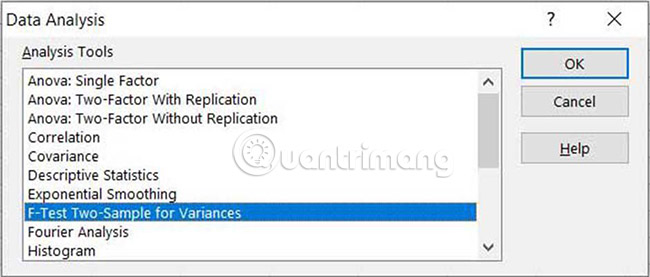
3. Select F-Test Two-Sample for Variances from the list, then press OK.
Warning : F-Test is very sensitive to non-normality. Therefore, it is safer to use Welch test, but this is more difficult to implement in Excel.
4. Select Variable 1 Range and Variable 2 Range , set Alpha (0.05 value for 95% confidence level), select a cell for the top left corner of the output (output will fill 3 columns and 10 Select OK.
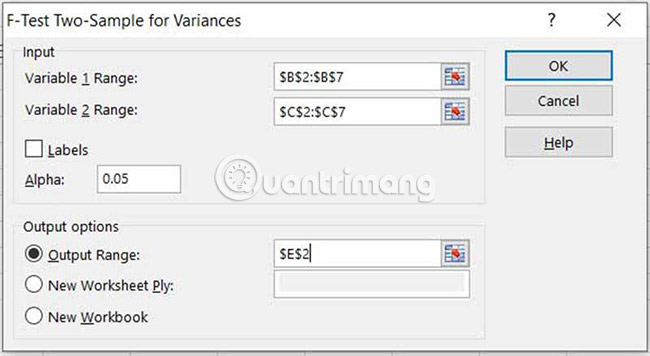
Important note : For Variable 1 Range , the sample with the largest standard deviation (or variance) must be selected.
5. See the F-Test results to determine if there are significant differences between the variances. Results for three important values:
- F : Ratio between variances.
- P (F <= f) one-tail: The probability that variable 1 does not actually have a variance greater than variable 2. If this value is greater than alpha, usually 0.05, there is no significant difference between the variance.
- F Critical one-tail : The value of F will be required for P (F <= f) = α. If this value is greater than F, this also shows that there is no significant difference between the variances.
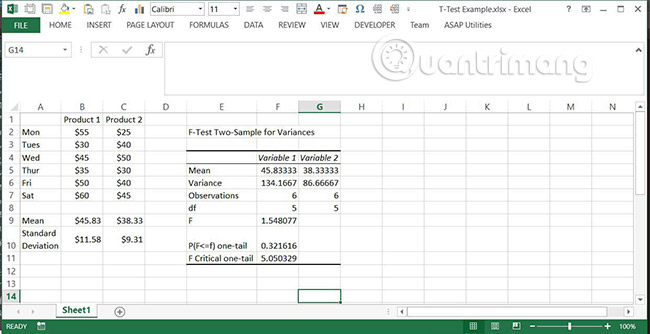
Note : P (F <= f) can also be calculated using FDIST with F and degrees of freedom for each sample as its input. The degrees of freedom are simply the number of observations in a sample minus one.
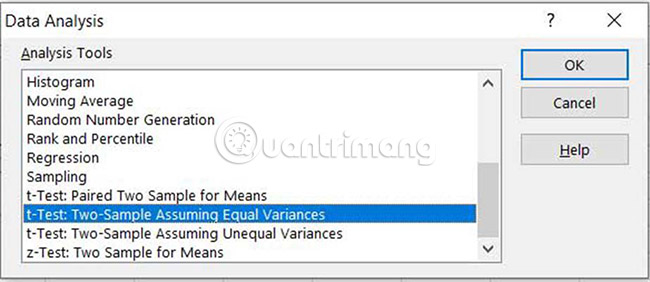
6. Now, you know whether there are differences between variances and can choose the appropriate T-Test. Select Data> Data Analysis tab, then select t-Test: Two-Sample Assuming Equal Variances or t-Test: Two-Sample Assuming Unequal Variances .
7. Regardless of which option you chose in the previous step, you will see the same dialog box to enter the analysis details. To start, select the range containing the templates for Variable 1 Range and Variable 2 Range .
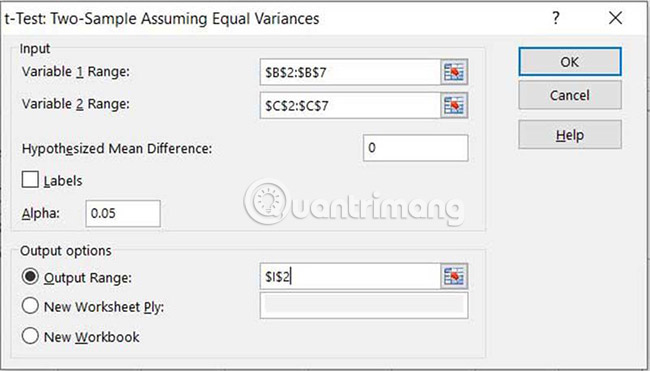
8. Suppose you want to check that there are no differences between the average values, set Hypothesized Mean Difference to 0 .
9. Set the significance level of Alpha (0.05 equivalent to 95% confidence level) and select a cell for the top left corner of the output (the output will fill 3 columns and 14 rows). Select OK.
10. Review the results to determine whether there are significant differences between the mean values.
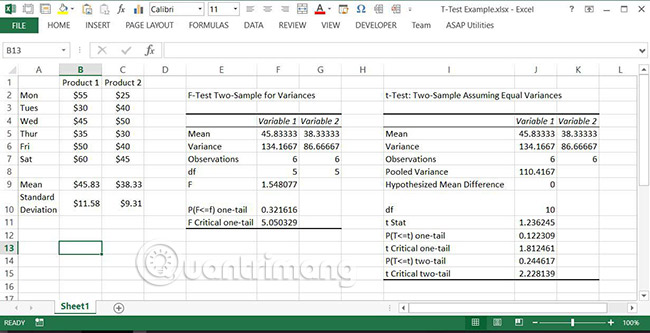
Note : As with F-Test, if the value of p , in this case P (T <= t), is greater than alpha, there is no significant difference. However, in this case, there are two p values given, one for the one-tailed test and the other for the two-tailed test. This case uses two-tailed values because one of the two variables with a higher average value will be a significant difference.
You should read it
- ★ Z.TEST function - The function returns one-sided value of the z test in Excel
- ★ CHISQ.TEST function - The function returns the independence test in Excel
- ★ T.TEST function - The function returns the probability associated with Student's t-Test in Excel
- ★ IQ test, IQ test, IQ test, intelligence test
- ★ Test keyboard online, test key online with the following 5 websites