How to Do Cost Volume Profit Analysis
Cost-Volume-Profit Analysis is an important tool from Cost Accounting to help managers decide how many units to sell, answer questions about the product mix, set profit targets reasonably -- all in accord with a given product's cost...
Table of Contents
Part 1 of 2:
The Tutorial
-
 Do price forecasting. This is a difficult job, because the price of the product must be known. While it may certainly depend a great deal on costs, certain other factors come into play. Among these are:
- Pricing policies per the demand curve and other considerations, such as growing the business at a certain pace.
- Market research studies
- Past sales volume
- General economic and industry conditions
- Relationship of sales to economic indicators such as GNP, personal income, employment, prices and industrial production
- Advertising and other promotional budget
- Quality of sales force
- Competition
- Seasonal variations
- Production capacity

- Long-term sales trends for various products, i.e. where in product life cycle it is.
- Research and development allocations in the recent past - product improvements.
-
 Understand that fixed costs, such as rent, depreciation, utilities and other costs that are incurred regardless of whether products are sold or not (unless one's depreciation is on the Units-of-Production basis) must be determined. Products may not be sold under cost due to anti-trust regulations and legislation. Some costs have a mixed fixed-variable component basis, which is fine to allocate between so long as treated on a consistent basis between planning periods.
 -
 Determine variable costs, and the costs which increase of decrease with increases and decreases in production. For example, a manufacturer of ski apparel will have velcro that fluctuates with jackets and warmup pants sold, as well as seasonal changes in production, and fill, etc., as well as a color mix to consider (which may need to respond rapidly to changes in consumer tastes).
 -
 Compute the product's Unit Contribution Margin, which is how much of the unit sales price remains towards Total Fixed Costs after Unit Variable Costs are deducted from the Unit Sales Price. For example, the ski apparel's unit price for a jacket might be $150 and the unit variable expenses $75, or 50% of the price. The unit variable costs include direct labor, machine production such as cutting and sewing 4 basic sizes for 2 sexes, then adult and children's, oil for the machinery and repairs to it as budgeted and are standard, etc. standard indirect labor such as color consulting, etc. The contribution margin of this jacket is $75 times the number of jackets projected to be sold, let's say 7812.5 (there are a few 1/2 size infant outfits made for special order). So that's $585,937.5 in total Contribution Margin towards Fixed Costs from this one jacket. Multiplied by 16 distributors of 8 jacket sizes and 8 pant sizes of 4 colors each size, that's 16*(32 + 32) * $585,937.5 = $600,000,000.00. We plan to increase our sales distribution marketing to 32 and double our sales if sales take off early in the season.
 -
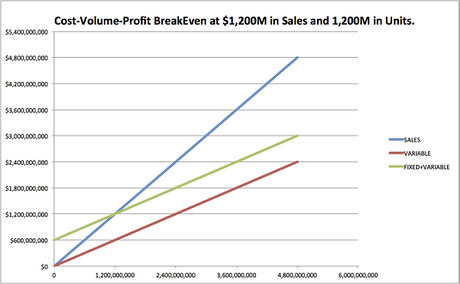
 Compute the Breakeven Point. The breakeven point equals the volume of sales it takes to cover all costs, and it is calculated by dividing the company's Fixed Costs by the Unit Contribution Margin (mixed, but here grossly simplified to be the same selling price and variable cost for pants and jackets, the only two products). For example, let's say the Fixed Costs for this Apparel Manufacturer are $300 Million. $300/50% = $600 Million Breakeven Point.
 -
 Estimate the budgeted profit or loss. Here, as mentioned, the Contribution towards Fixed Costs based on a reasonable sales projection of selling 7812.5 units of each of 8 jackets and 8 pants of 4 colors each at 16 distributors for $150/selling price per unit will total 1,200,000,000 and that our BreakEven Point is $600,000,000. You'll therefore anticipate a profit of $0 on sales of $150*7812.5* 1024 = $1,200,000,000.00, which is a ROS (Return on Sales) of 0%, and a Return on Fixed Costs of $0/300M = 0% -- so you can pretty much roll with seasonal changes every two years and stay right with the fast-moving market of ski fashion, in which there's almost always a role for the high-end warmup pants and jacket customer, and just break even.
 -
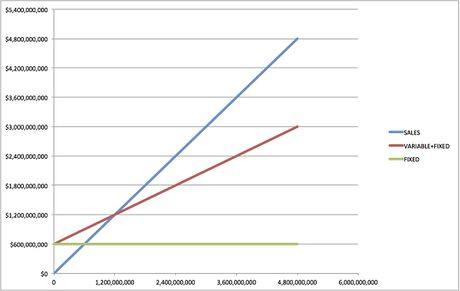
 Understand that every sale made after the $1,200,0000,000 mark is pure profit. If we do increase our marketing efforts to 32 distribution points with sales of $2,400,000,000, we'll make a profit of $600,000,000 -- enough to purchase a new factory, or rather, set of Fixed Costs. The ROS would then be $600M/$2,400M or 25%, and the return to Fixed Costs would be $600M/300M or 200%.
 -
 Reading the chart herewith, since $ are charted vertically along the y-axis and Units run along the x-axis horizontally at the bottom, at 3.6 million (M) units, reading up to the Sales line there are $3.6M in sales dollars. The Total Fixed and Variable Expenses line has been crossed at $2.4M (consisting of $600,000 in Fixed Expenses and $1.8M of Variable Expenses). So, by subtracting the Total Fixed and Variable Expenses of $2.4M form the Total Sales Revenue of $3.6M, one learns that the profit forecast equals the difference of $1.2M. At $0 of Sales, the Fixed Expenses of $600,000 must still be paid, and that would also be the amount of Loss incurred.
Part 2 of 2:
Helpful Guidance
- Make use of helper articles when proceeding through this tutorial:
- See the article How to Create a Spirallic Spin Particle Path or Necklace Form or Spherical Border for a list of articles related to Excel, Geometric and/or Trigonometric Art, Charting/Diagramming and Algebraic Formulation.
- For more art charts and graphs, you might also want to click on Category:Microsoft Excel Imagery, Category:Mathematics, Category:Spreadsheets or Category:Graphics to view many Excel worksheets and charts where Trigonometry, Geometry and Calculus have been turned into Art, or simply click on the category as appears in the upper right white portion of this page, or at the bottom left of the page.
Was this article helpful?
Your feedback helps us improve.
Related Articles
 What is the volume label for a volume?8 minutes read
 What is Search volume? Why care about search volume?3 minutes read
 7 ways to fix low volume in Windows 107 minutes read
 How to Change Volume on Mac2 minutes read
 How to Set Volume Limit: iPhone Feature That Keeps You From Being Startled by Loud Media Sounds3 minutes read
 How to Dismount a Volume3 minutes read
Reader Comments 0
Sign in with email or Google to join the discussion.