How to compare future budget forecasts side-by-side in a conversation with Claude.
Enter your budget allocation and any variable elements, and Claude will draw three scenarios side-by-side, with the option to switch between monetary amounts and percentages..
Enter your budget allocation and any variable elements, and Claude will draw three scenarios side-by-side with the option to switch between amounts and percentages. Click on any scenario to see a brief summary of the key points under pressure.
1. Job Description
Scenario planning is more time-consuming than difficult, as it mostly involves opening spreadsheets, copying tabs, adjusting figures, and comparing. When the board meeting is only an hour away, what you really want is to compare multiple future scenarios side-by-side and get a quick look at which one is most damaging.
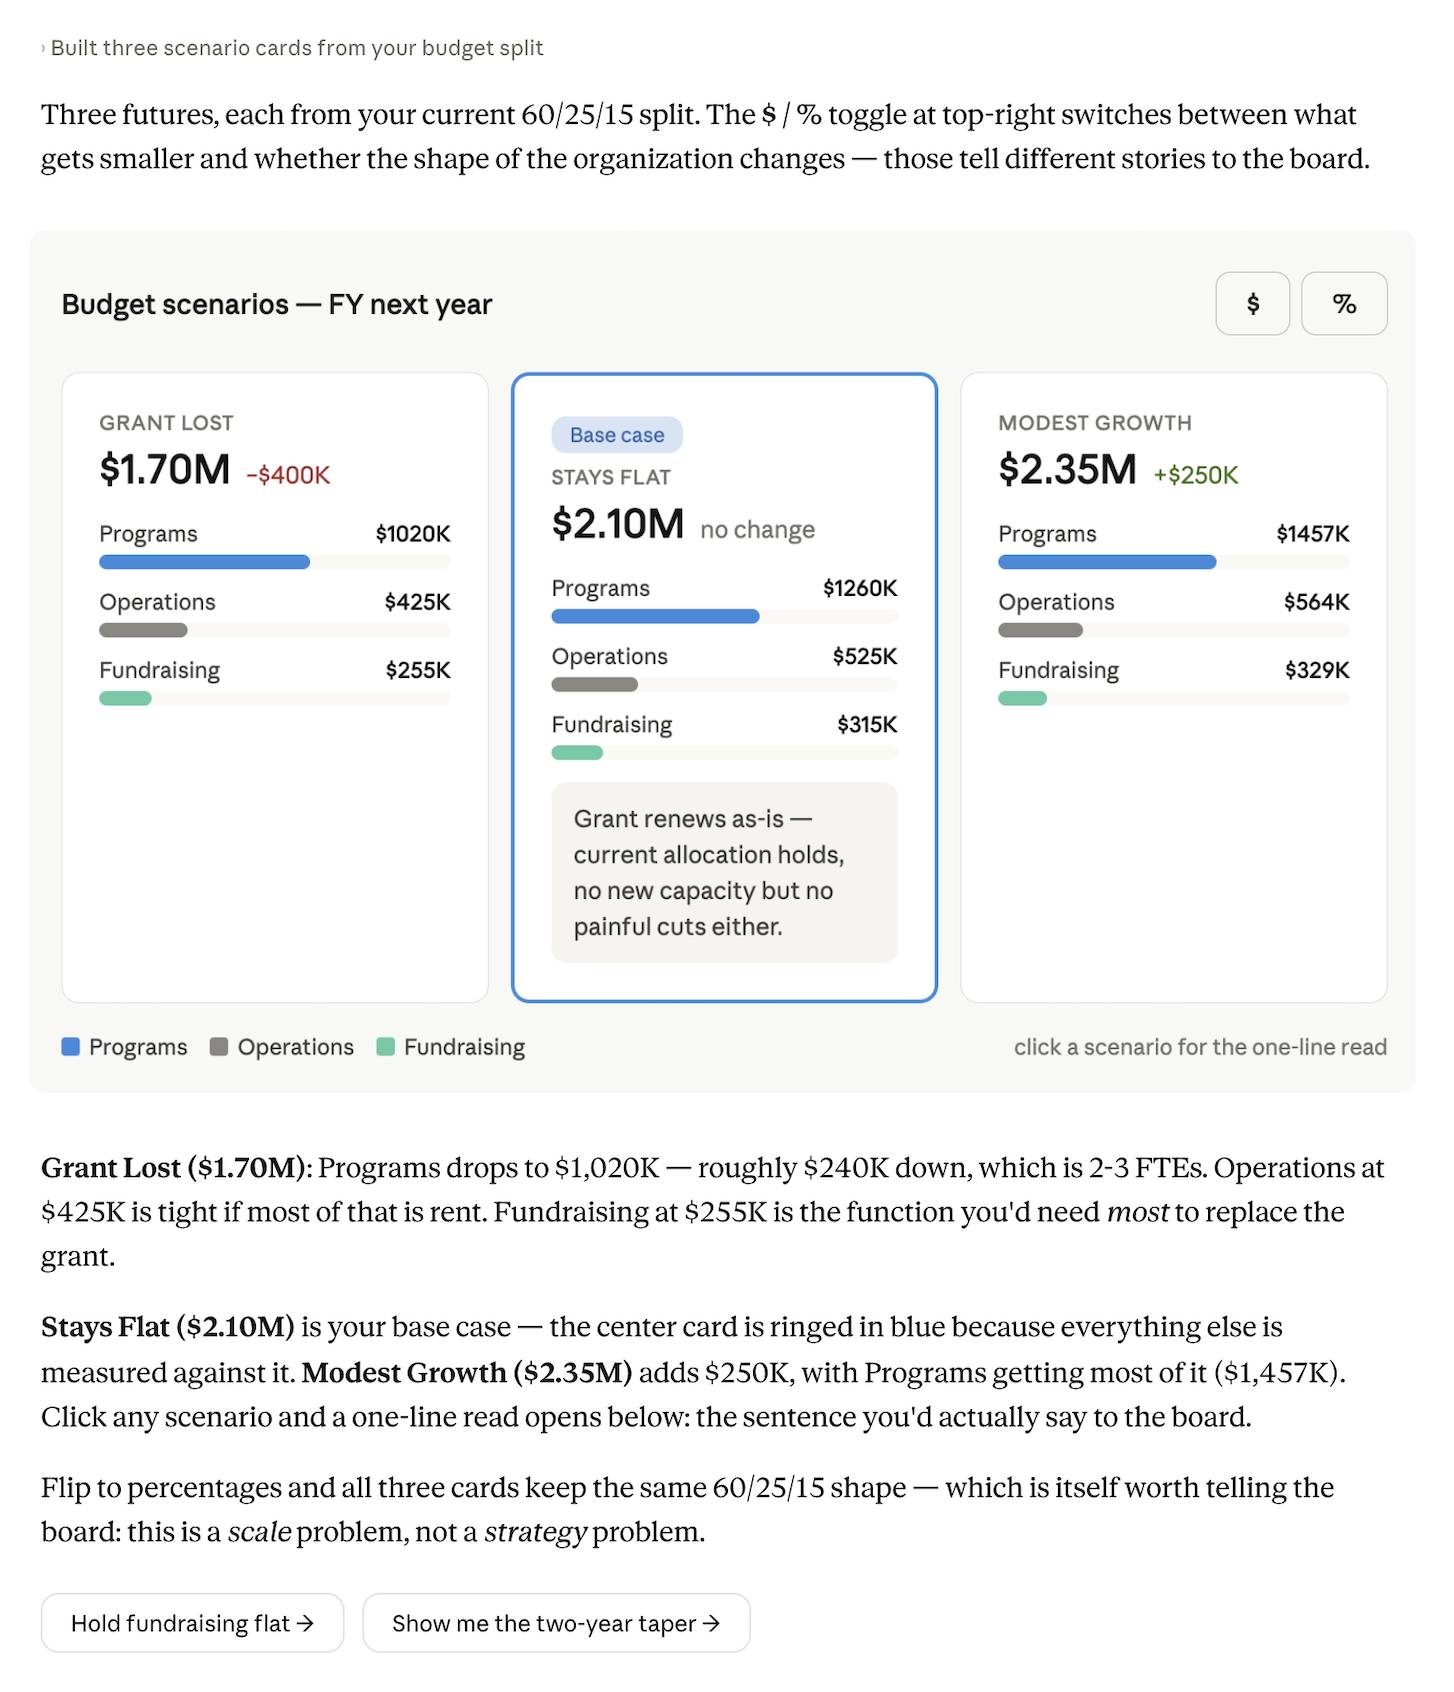
Tell Claude about your budget in one sentence along with any possible changes, and stacked bar charts will appear side-by-side with the option to switch between amounts and percentages. Clicking on any scenario will give you a brief summary of its true meaning for the organization, usually the sentence you need to tell the board.
An executive might lose a large grant and need to walk into a board meeting with a clear picture of what that would look like compared to steady, moderate growth. Claude draws the charts side-by-side, and rate cuts for those programs will pop up as a warning even before the executive clicks.
Chúng ta có thể mất khoản tài trợ 400.000 USD vào năm tới. Ngân sách hiện tại khoảng 2,1 triệu USD: Khoảng 60% dành cho chương trình, 25% cho hoạt động, 15% để gây quỹ. Hãy cho tôi xem ba kịch bản cạnh nhau: Chúng ta mất khoản tài trợ, ngân sách giữ nguyên, và tăng nhẹ. Tôi muốn chuyển đổi giữa số tiền và phần trăm. Khi nhấp vào một kịch bản, hãy cho tôi phiên bản một dòng về ý nghĩa thực sự của nó.2. Provide context for Claude.
The numbers you enter in the question are context-sensitive, and approximations are fine since this is a shape comparison, not a budget. A total figure with percentages allocated to your main categories is sufficient, and if you know which categories are fixed (e.g., "operating expenses are primarily rent"), mention that so Claude can maintain that curve across scenarios.
Required context
No uploading is required. Simply enter the numbers directly into your question.
3. What Claude created
Claude draws three stacked bar charts side-by-side with a toggle button at the top to switch between monetary and percentage views. The monetary view shows you what decreased, while the percentage view shows whether the organization's balance changed or simply decreased proportionally. Items that decreased are highlighted, and clicking on any scenario opens a brief note below, explaining the practical meaning of the numbers for the operation.
4. Subsequent prompts
Continue the conversation with Claude to refine, expand, or learn more.
Click the button to redraw with a constraint.
Cutting proportionally is rarely something you'll actually do, so this button keeps one item fixed and reallocates the spacing, showing you where the real pressure is concentrated.
Chạy lại Kịch bản A nhưng giữ nguyên mức gây quỹ với số tiền hiện tại. Cho tôi biết khoản cắt giảm thêm sẽ đi đâu và viết lại câu cho ngắn gọn.Claude was asked to extend a script over time.
A one-time cut is different from a gradual reduction in the budget, so asking Claude to redraw the scenario for the second year could change the understanding of what the organization can withstand.
Điều gì sẽ xảy ra nếu khoản tài trợ không giảm cùng một lúc? Giả sử chúng ta mất một nửa trong năm đầu tiên và phần còn lại trong năm thứ hai. Vẽ lại Kịch bản A trong hai năm và cho tôi biết liệu điều đó có làm thay đổi cách hiểu vấn đề hay không.Thanks to Claude for writing the board-ready version.
The bar charts show you the shape, but what the board needs is a concluding sentence, and Claude can translate each scenario into what you would actually say.
Đối với mỗi tùy chọn trong ba kịch bản, hãy viết cho tôi một câu mà tôi sẽ nói với hội đồng quản trị. Sự đánh đổi thực sự, chứ không phải các con số.5. Tips, tricks, and troubleshooting
The way you phrase your question will shape what you get in return.
Requiring scenarios to be placed "side-by-side" with a toggle switch "between amounts and percentages" creates a comparative view instead of three separate charts. Naming the decision context ("board meeting in an hour") tells Claude that this is about quickly seeing the shape, not building a model you'll give to the finance department. The same approach applies to any multi-scenario question, whether it's staffing planning, program expansion, or anything else where you're considering three future scenarios and need to see which one causes more damage.
Compare the image to your own understanding.
The allocation ratio Claude initially presented is merely a starting point, not a recommendation, as you know which items have contingency resources and which are primarily fixed costs. If the summary of Scenario A doesn't align with your perception of where the actual damage will occur, tell Claude what you're seeing, and the next version will be closer to what you truly want to present.
The next step is to work with the images.
Hover over the screen to see options to copy the 3-bar comparison chart as an image for your board presentation, or save it as a document if you want to display it directly in the meeting and click through the scenarios while monitoring the board's reaction. You can also ask Claude to write a one-sentence summary of the key points for each scenario so you're ready to present.