Instructions for drawing charts with AI accurately and quickly
In this article you will have more tools to draw charts using AI very simply, accurately, saving time and operations..
AI tools are now widely used in the field of education and learning, supporting teachers and students in their work. In this article, you will have an additional tool to draw charts using AI that is very simple, accurate, saves time and operations.
How to draw charts with AI correctly
Step 1:
First, click on the link below to go to the Venngage AI tool page.
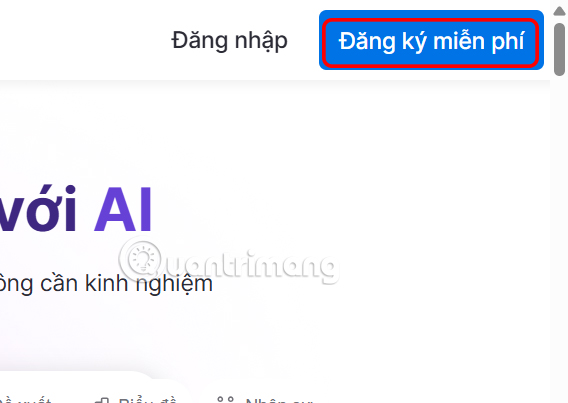
https://venngage.com/Here you click on Register for free to create a free account.
Now you will choose to register with your Google account to use the Venngage AI tool.

Step 2:
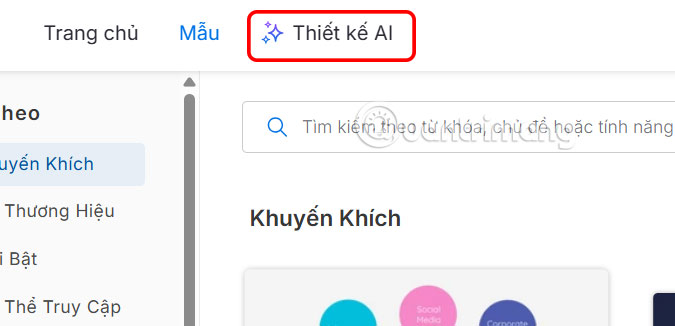
Go to the main interface of Venngage AI, click on AI Design to use.
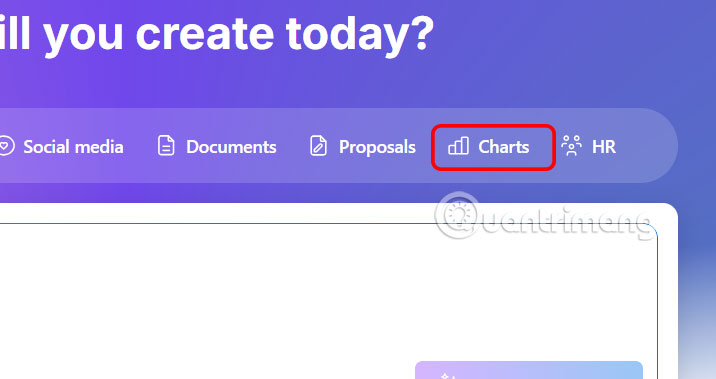
Now click on Charts to create a chart using AI technology.
Step 3:
Enter detailed information about the data you want to create a chart for into the box. The more detailed you enter, the more accurate the chart will be. Then click create as usual.
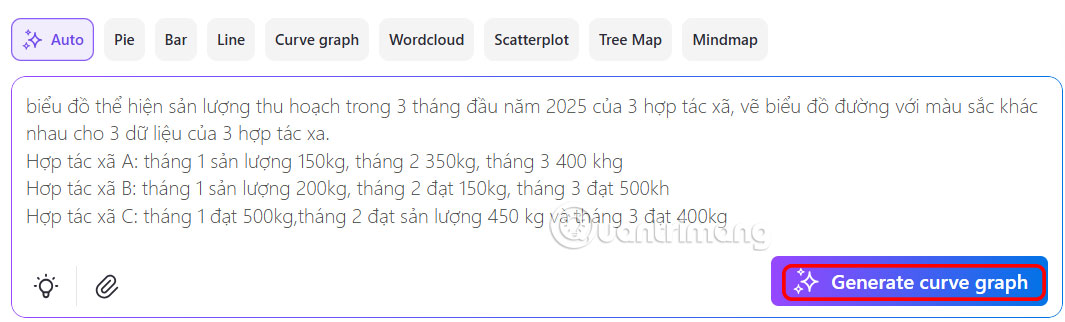
Step 4:
You wait for a while and get the chart based on the content you entered as shown below.
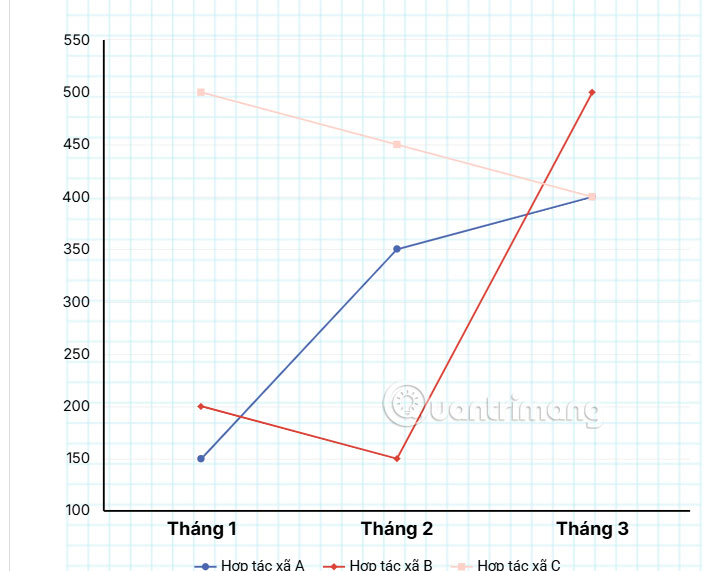
We can click Customize to edit the chart as we like.

Step 5:
Switch to the chart customization interface, you use the tools to change the chart interface to your liking.
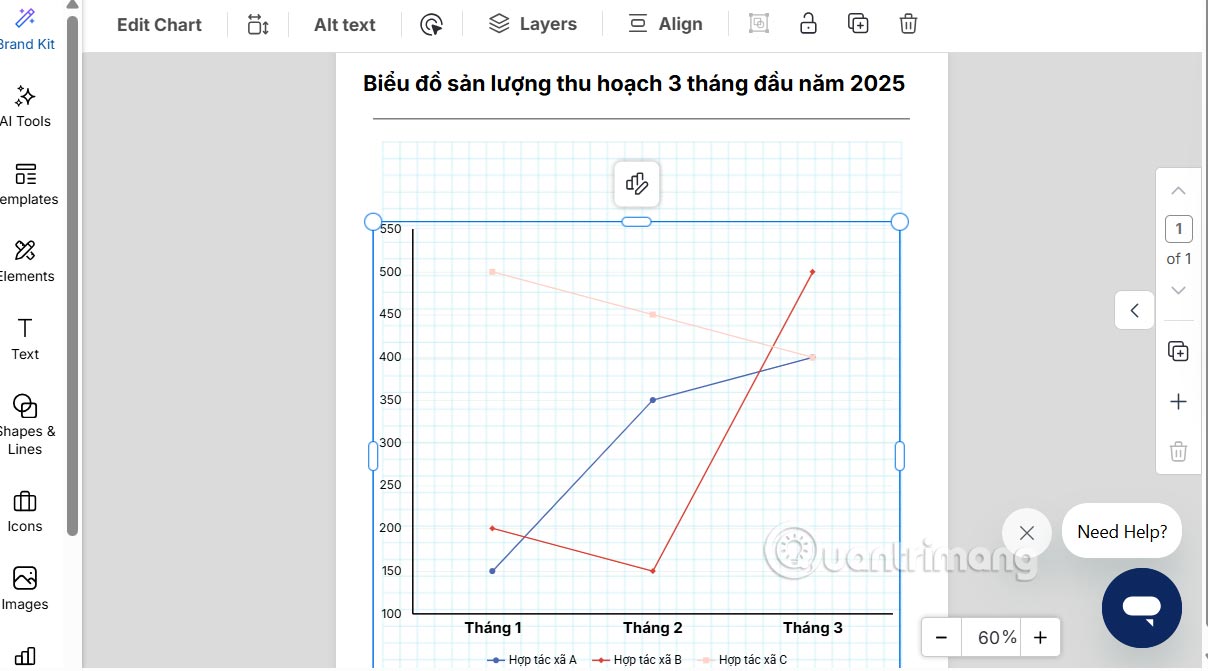
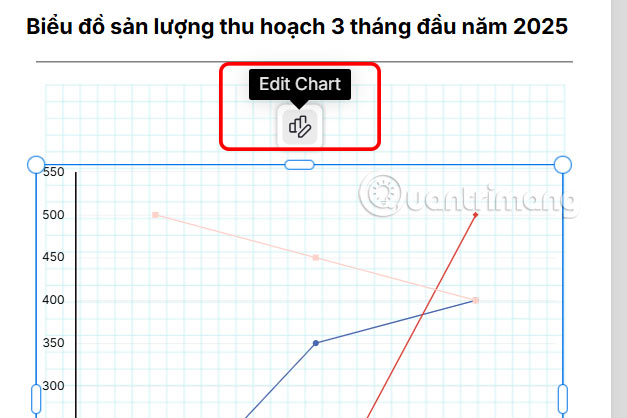
Click on the chart and then click Edit chart to edit the chart.
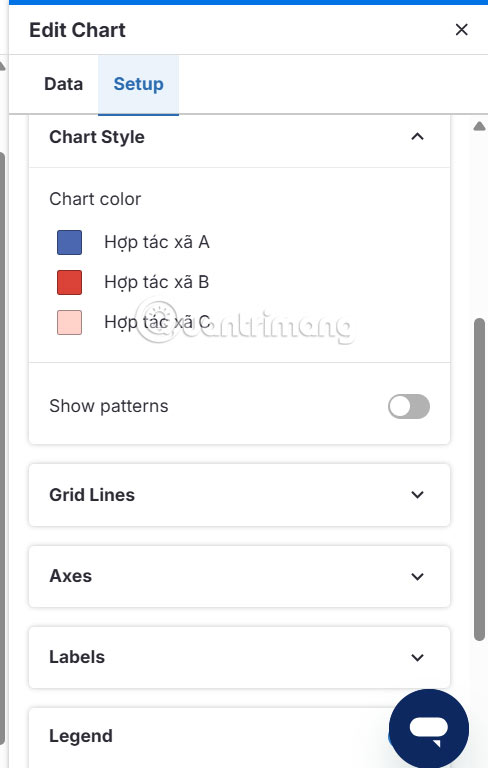
Step 6:
On the right side of the interface are options to change the chart and the data, the colored lines displayed, or change the chart style.
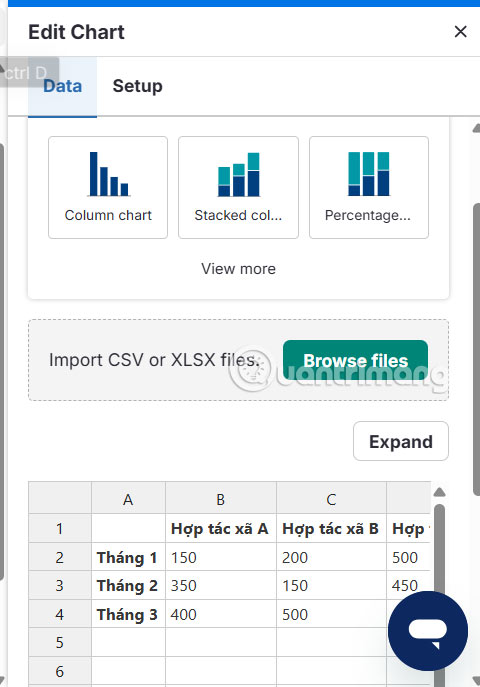
You click on each item to change the chart as you like.