Working with Network Monitor (Part 2)
In the first part, I explained the difference between the versions of Network Monitor and the process of installing it. This second part will continue the discussion by introducing how to use this interesting tool.
 Working with Network Monitor (Part 1)
Brien M. Posey
In the first part, I explained the difference between the versions of Network Monitor and the process of installing it. This second part will continue the discussion by introducing how to use this interesting tool.
As I explained in Part 1, there are two different versions of Network Monitor tool. For the purposes of this article we use the full version (Full) with SMS Server 2003 Service Pack 1.
Network Monitor interface
When launching Network Monitor, the first thing you see is a message asking you to select the network interface you want to capture data. This is an important step because if you leave the interface selected, Network Monitor will pick up an arbitrary interface and this interface may not be the interface you want.
Click OK and you will be taken to the screen like Figure A below. Simply select the network interface you want to use then click OK.

Figure A: Select the network interface you want to check.
Here, Network Monitor will display the main capture screen, shown in Figure B. Before I show you how to use this screen, I want to mention that Network Monitor only suggests selecting the network you want to check. when you first use it. If your computer has only one network adapter, this should not be a problem. If the system has multiple network segments, you can check the traffic of all network segments.

Figure B: Network Monitor capture screen
The downside is that you cannot check traffic through network segments simultaneously, but you can switch network segments even if Network Monitor does not automatically suggest the network segment you want to check. To do so, simply select the Networks command from the Capture menu. You should now see a screen like the one shown in Figure A. The biggest difference between these two screens is that the following screen has the Remote option that you can use to capture remote data packets.
Take a look at the capture screen. As you can see in the picture, this screen has 4 different panels. The panel at the top left of the window is the chart panel. The chart panel displays the current action level by graphs during the capture process. It includes charts showing the percentage of network usage, the number of frames captured, the number of bytes captured, the number of broadcast and multicast per second.
You can see in the picture that there is a scroll bar related to the chart panel. This scroll bar is easily confused because there are no charts except those shown in the picture.
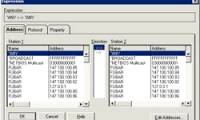
Under the chart panel is the session statistics panel. This panel is designed to display the total amount of traffic captured. This section shows things like the host's network addresses related to a situation, the host-initiated address for this situation.
The bottom of the screen includes the session statistics panel. This panel displays all capture information. The network address of each host is also displayed along with the number of frames sent / received, the number of bytes sent / received and the number of frames, multicast and broadcast in the direction to be sent.
The upper right part of the window is the entire statistics panel. As the name implies, this panel displays statistics related to all the captured network traffic. This panel displays the same types of information as the other panel information mentioned, but the only difference is that it does not reduce the statistics on each basic host.
Capture network traffic
Now that I will be operating in this interface, we will perform the capture of network traffic. If you look at Figure B, you will see the toolbar above the chart panel. This toolbar is used to control capturre process. The buttons related to capture on this toolbar are listed below:
-
 Capture Data - Capture data
 -
 Pause bắt đầu hoặc capture paus lại - Pause capture or resume capturre paused
 -
 Stop the capture process - Stop the capture process completely.
 -
 Stop the capture and view the captured data - Stop capture and view captured data
 -
 View the captured data - View captured data
 -
 Help - Help
To capture data using Network Monitor, click the Capture Data button. Network Monitor will start capturing data and will not stop until it stops or pauses. The data capture process is similar to what you see in Figure C.
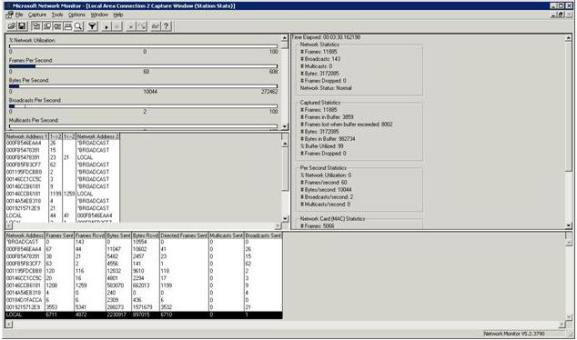
Figure C: Network Monitor interface when capturing data
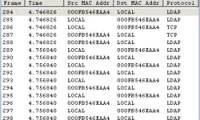
As you can see in the figure, it contains a lot of statistics, but no real data. If you want to see the captured data, you will have to click the View Data button on the toolbar. That way you will see the screen like Figure D.
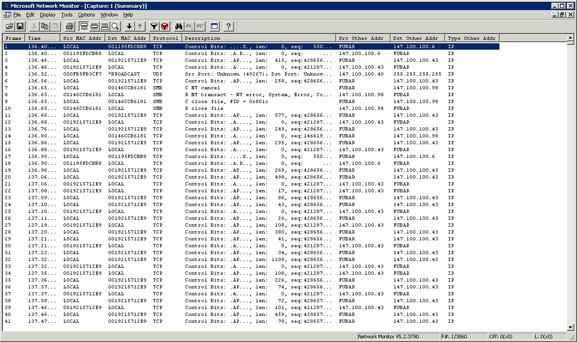
Figure D: Data captured
If you take a closer look at the captured data, you will see that what Network Monitor is displaying is all the individual frames that have been captured. This screen lists the frame number, the time that the frame was captured, the source and destination address, the protocols used . but does not display the data in the frame. However, there is an easy way to see more detailed information.
If you look at the toolbar you will see that there are 3 buttons with 3 rectangles:

These buttons allow you to move forward and backward in the detailed panel, the overall and the count panel. 16. When all three panels are activated, you can see all the selected frames as shown in Figure E. .
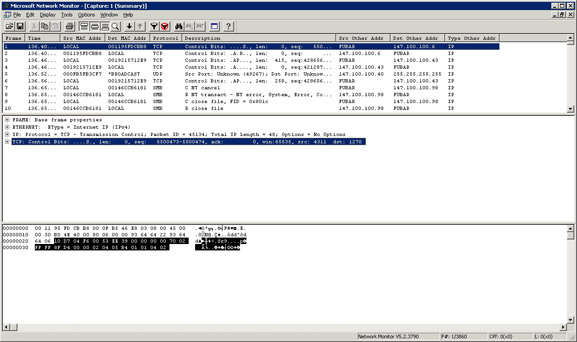
Figure E: 3 panel shows all the information related to the selected frames.
As you can see in the figure, the Details panel displays protocol information for the currently selected frame. When a frame has multiple protocols, the same external protocol is listed first. The 16-count panel displays the actual frame data. Notice in the picture that only part of the frame is selected in the Details panel. The selected part will be highlighted in the count panel 16 to help you isolate the data.
Conclude
In this article, I have discussed the basics of using the Network Monitor tool. In Part 3 we will continue the introduction of a simple sample capture to show you how to analyze captured data.
 Working with Network Monitor (Part 3)
 Working with Network Monitor (Part 4)
 Working with Network Monitor (Part 5)
Was this article helpful?
Your feedback helps us improve.
Related Articles
 Working with Network Monitor (Part 1)8 minutes read
 Working with Network Monitor (Part 4)8 minutes read
 Network testing with Network Monitor 3.4 - Part 17 minutes read
 Working with Network Monitor (Part 3)9 minutes read
 Learn about Microsoft Network Monitor tool - part 17 minutes read
 Working with Network Monitor (Part 5)8 minutes read
Reader Comments 0
Sign in with email or Google to join the discussion.