Table of Contents
You can create an infographic entirely in a browser with Canva, Visme, Piktochart, Venngage or Infogram. The right choice depends on whether you need simple templates, interactive storytelling, strong data charts, brand controls or team collaboration.

Quick comparison
| Tool | Best for | Notable strength |
|---|---|---|
| Canva | Beginners and general-purpose design | Simple editor and a broad visual library |
| Visme | Interactive and branded business content | Animation, sharing and team controls |
| Piktochart | Reports and fast data storytelling | Infographic-focused templates and AI-assisted starting points |
| Venngage | Business, HR and process visuals | Structured templates and drag-and-drop editing |
| Infogram | Data-heavy and embeddable graphics | Interactive charts, maps and live embeds |
All five services let you begin online, but free-plan exports, branding, storage, collaboration and asset access can be limited. Check current plan terms before building a client or recurring project around one platform.
1. Canva: easiest all-rounder
Canva works well for a first infographic because its editor, templates, type controls, charts and visual assets are approachable. It is also useful when the same content must be adapted into a presentation or social post. Avoid publishing a template with only the text replaced; simplify the palette, remove decorative clutter and make the information hierarchy your own.
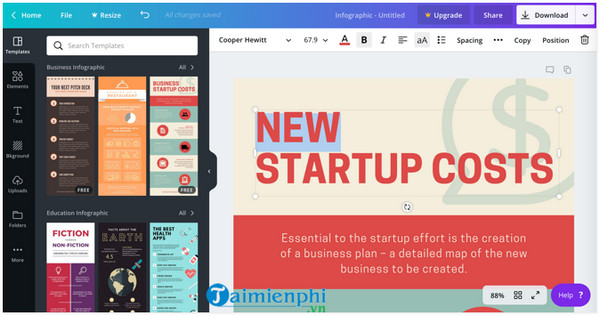
Open Canva's official infographic maker
2. Visme: strong for interactive stories and teams
Visme combines infographic templates with charts, animated elements, sharing and embedding. Its team features include brand guidance and permissions, which can help organizations keep recurring graphics consistent. Confirm which download, analytics and collaboration features are available in the plan you intend to use.
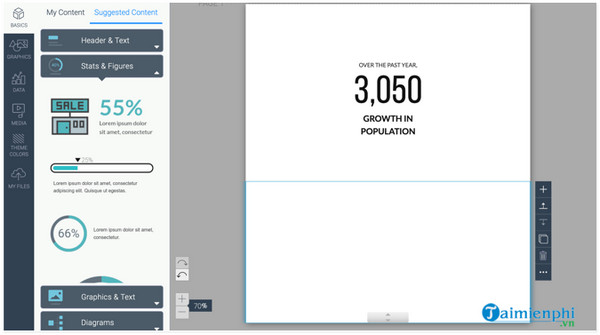
Open Visme's official infographic maker
3. Piktochart: focused infographic workflow
Piktochart is built around infographics, reports and visual documents. Its browser editor supports templates, charts, images and online sharing, while its current platform also promotes AI-assisted creation. Treat generated layouts as a draft: verify every number, rewrite generic copy and adjust the visual order manually.
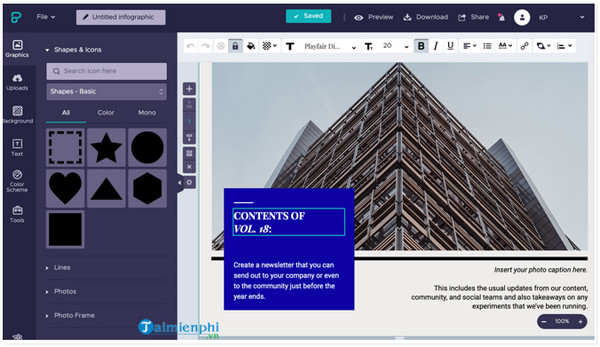
Open Piktochart's official infographic maker
4. Venngage: practical for business information
Venngage offers templates for comparisons, timelines, processes, reports and other structured business communication. It is a good candidate when layout guidance matters more than free-form illustration. Check current export and brand-kit access because capabilities vary by plan.
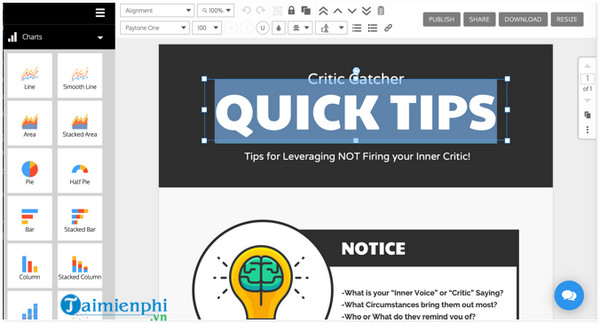
Open Venngage's official infographic maker
5. Infogram: best for charts, maps and embeds
Infogram is the most data-centered option in this group. It supports charts, maps, interactive infographics and responsive embeds that can update when a project changes. It is especially useful for dashboards, news graphics and reports where the numbers—not decorative templates—are the main story.
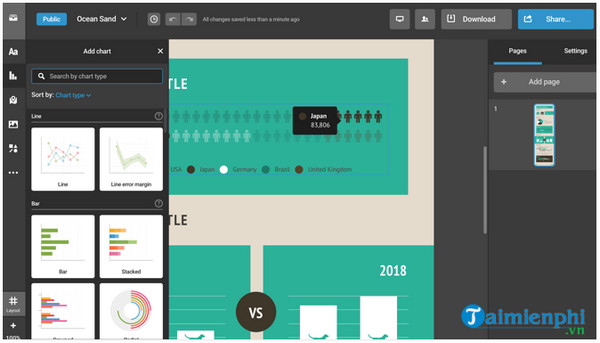
Open Infogram's official infographic maker
How to create a useful infographic
- Define one question. An infographic should answer a focused reader need, not hold every fact from a report.
- Verify the data. Keep a source list, date labels and units for every statistic.
- Sketch the hierarchy. Plan a title, short sections and one clear reading path before choosing decoration.
- Use appropriate charts. Match bars, lines, maps or proportions to the relationship in the data; do not distort axes or areas.
- Design for the destination. Set dimensions for the web page, social network, slide or print size where the graphic will appear.
- Check accessibility. Use readable type, adequate contrast, direct data labels and alt text or an HTML summary when publishing online.
- Export and inspect. View the final file at its actual display size and test any links, animation or embed code.
Which tool should you pick?
Choose Canva for the shortest learning curve, Visme for interactive branded content, Piktochart for a guided infographic workflow, Venngage for structured business templates, and Infogram for data visualization and live embeds. Build a small test graphic before paying so you can verify export quality, fonts and collaboration.
For more options, compare TipsMake's broader list of online infographic tools, explore online poster makers, or review tools for creative work.
Related Articles
 Top 10 Websites to Create Beautiful Infographics5 minutes read
 Create Infographics on Lovart Extremely Quickly3 minutes read
 Design Infographics on Gamma AI with Just Voice Commands3 minutes read
 How to Create Infographics with AI Simply: Step-by-Step Guide7 minutes read
 Design Infographics in Canva AI from Data4 minutes read
 Guide to Creating Infographics on Manus4 minutes read
Reader Comments 0
Sign in with email or Google to join the discussion.