Table of Contents
Lovart can turn a written brief into an infographic, making it useful when you need a quick visual draft without laying out every element by hand. The quality of the result depends heavily on the prompt: specify the subject, audience, sequence of information, visual style, colors and labeling requirements before generating the design.
How to create an infographic in Lovart
1. Open Lovart and start a project
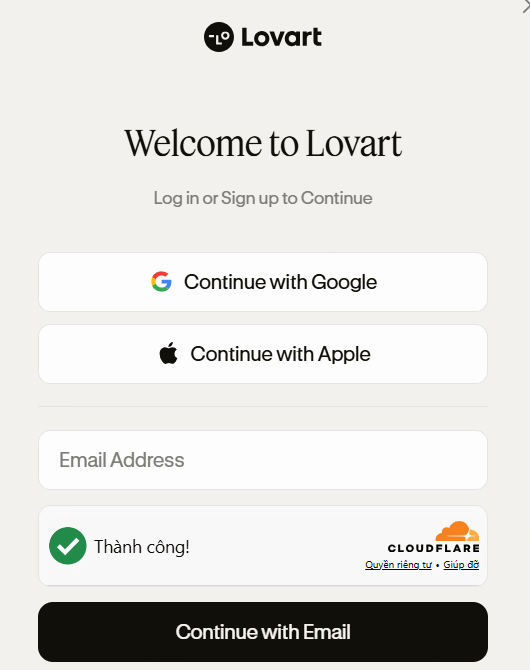
Go to Lovart and sign in using one of the available account options. The interface may change over time, but the main workflow starts from the prompt or project input area.
2. Write a specific infographic prompt
Describe what the infographic should explain rather than entering only a broad topic. Include the intended audience, the number and order of sections, preferred colors, labels, icons or diagrams, and the language of the finished text. A clear information hierarchy helps the generator produce a design that is easier to read.
The original example asks Lovart to create a Vietnamese-language infographic showing five stages of a volcanic eruption, with glowing red-orange lava, flow arrows and clear labels for primary-school students:
tạo Infographic tiếng Việt mô tả 5 giai đoạn phun trào núi lửa từ hình thành magma, tích tụ trong buồng magma, áp suất tăng, phun trào dung nham đến nguội tạo địa hình mới, với màu đỏ–cam phát sáng cho dung nham, mũi tên dòng chảy và nhãn rõ ràng cho học sinh tiểu học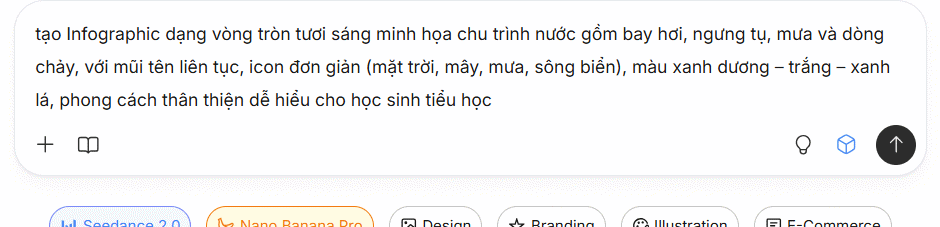
If you need ideas for layout or want to compare tools before committing to one workflow, see these guides to free infographic tools and online infographic creators.
3. Review the generated design
Wait for Lovart to generate the first version, then check more than its visual appearance. Verify spelling, labels, step order, numerical values and whether every graphic matches the accompanying text. AI-generated artwork and text can contain mistakes, so do not publish the first result without reviewing it.
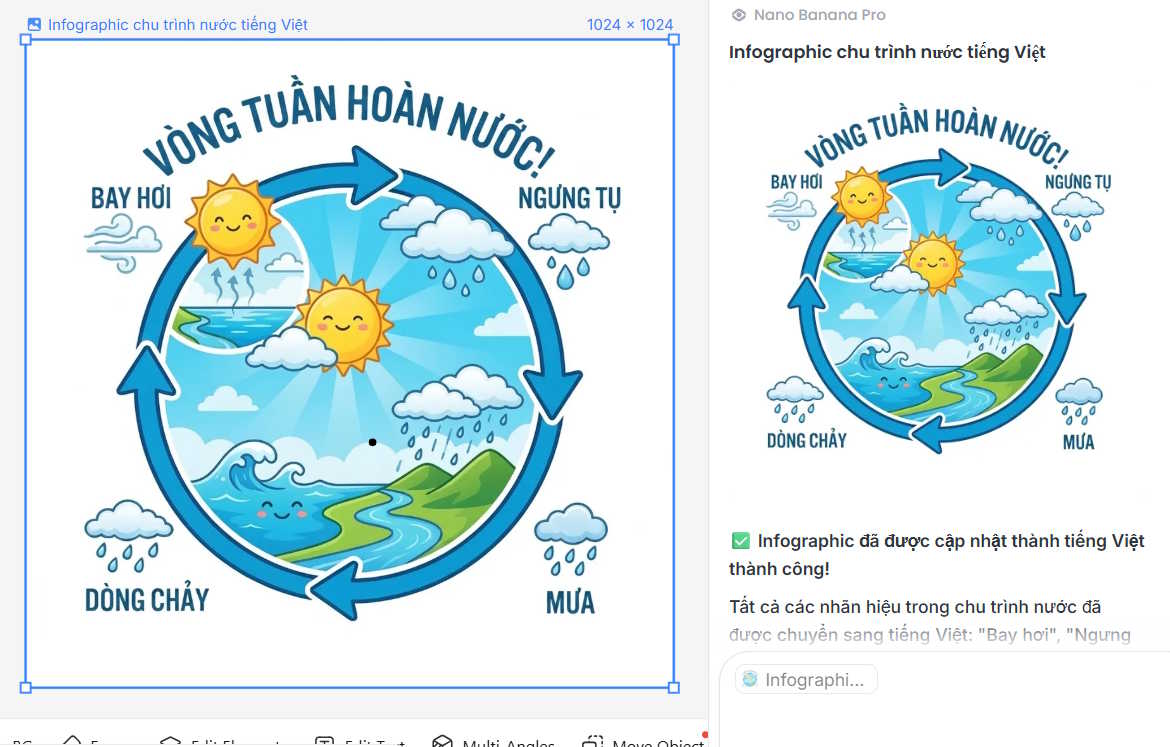
When something is wrong, request a focused revision. Identify the exact text, section or visual that needs changing instead of asking Lovart to redo the entire infographic. Small, specific corrections usually make it easier to judge whether the new version solved the problem.
4. Download the finished infographic
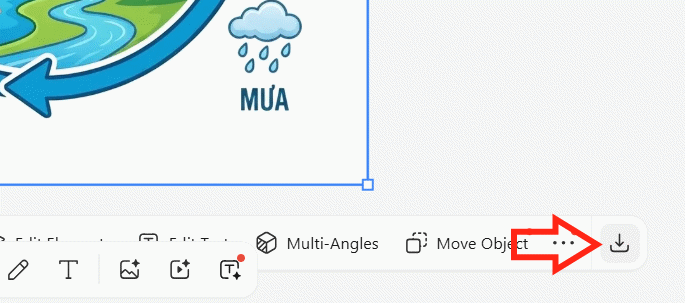
Once the design is accurate, select the image and use the save or download control shown in the editor. If Lovart offers several formats or sizes, choose one suitable for its destination: a high-resolution image for print, or a smaller optimized file for a website or social post.
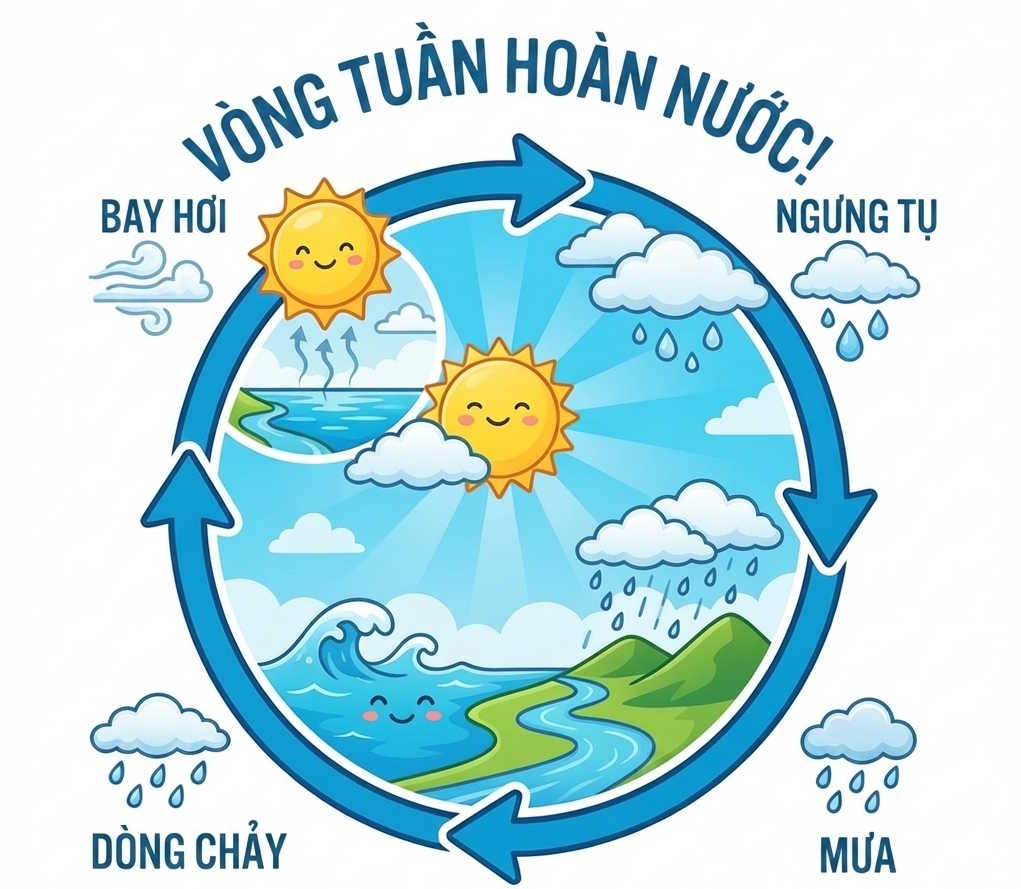
Tips for a cleaner result
- Keep each section focused on one idea and ask for short labels.
- State the reading order when the topic follows a process or timeline.
- Specify a limited color palette and sufficient contrast.
- Check all generated facts and text against the source material.
- Request one precise change at a time when refining the design.
Lovart is best treated as a fast starting point. A careful prompt can produce a useful draft, but human review is still necessary before the infographic is shared or published.
Related Articles
 How to Create Infographics with AI Simply: Step-by-Step Guide7 minutes read
 Design Infographics in Canva AI from Data4 minutes read
 Top 10 Websites to Create Beautiful Infographics5 minutes read
 Design Infographics on Gamma AI with Just Voice Commands3 minutes read
 Top 5 Websites for Creating Beautiful Online Infographics4 minutes read
 What Is ChatGPT Images 2?6 minutes read
Reader Comments 0
Sign in with email or Google to join the discussion.