JavaScript code to create bubble charts and graphs.
The example below shows a bubble chart created using JavaScript, along with the source code that you can edit in your browser or save to your computer to run locally..
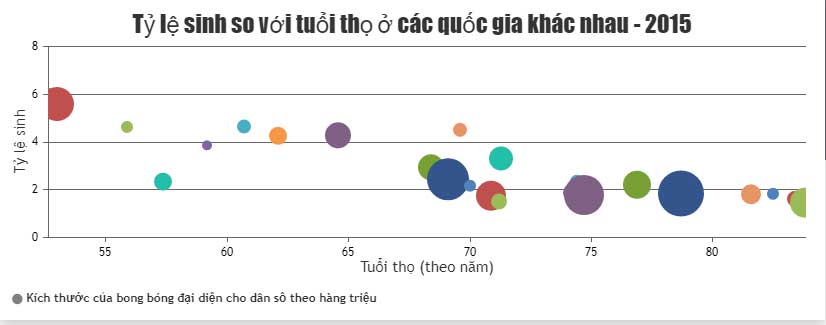
Bubble plots, created using JavaScript, allow you to visualize data in three dimensions. They are very similar to scatter plots, except that the size of the bubbles represents a different parameter/aspect. In addition to the three required parameters (x, y, z), x and y define the bubble's position on the X and Y axes, while Z defines its size. One of the key features of bubble plots is that the Z value of a data point is proportional to the bubble's area, not its diameter or radius.
The example below shows a bubble chart created using JavaScript, along with the source code that you can edit in your browser or save to your computer to run locally .
Source : CanvasJS
Customize charts
Like any chart created with JavaScript, you can change the properties to get the desired result. For example:
markerType: Marking stylemarkerBorderThickness: Border thickness of the markmarkerBorderColor: Border color of the markermarkerColor: Color marking- .