Table of Contents
Ask Claude to build a gift pyramid with explicit gift amounts, counts, and prospect assumptions. Then compare the calculated requirements with your organization's actual donor pipeline. A campaign target alone cannot tell Claude how many qualified prospects you have.
The useful output is a transparent planning model: what would be required to reach the target, which assumptions drive it, and where your available information is incomplete.
1. Start with a gift table that adds up
For an illustrative $2 million campaign, this six-tier table reaches the goal exactly. It is a sample allocation, not a recommended structure for every organization.
| Gift amount | Gifts needed | Tier total | Prospects at assumed 3:1 ratio |
|---|---|---|---|
| $500,000 | 1 | $500,000 | 3 |
| $250,000 | 2 | $500,000 | 6 |
| $100,000 | 4 | $400,000 | 12 |
| $50,000 | 6 | $300,000 | 18 |
| $25,000 | 8 | $200,000 | 24 |
| $10,000 | 10 | $100,000 | 30 |
| Total | 31 | $2,000,000 | 93 |
Here, 3:1 means three qualified prospects are assumed for each completed gift. It is a modeling input, not a guaranteed conversion rate or a universal industry standard. Replace it with a defensible assumption based on your own campaign history, and test alternatives.
2. Request the pyramid without inventing donor data
Build an illustrative gift pyramid for a $2,000,000 fundraising campaign.
Use these gift counts: 1 at $500,000; 2 at $250,000; 4 at $100,000; 6 at $50,000; 8 at $25,000; 10 at $10,000.
Verify the total first.
For each tier show gift size, gifts needed, tier total, and prospects needed using an assumed 3:1 prospect-to-gift ratio.
Add an editable actual-prospect count for each tier, initially marked unknown.
Do not invent typical donor availability or label unknown counts as zero.
Highlight a shortfall only when an actual count has been supplied.
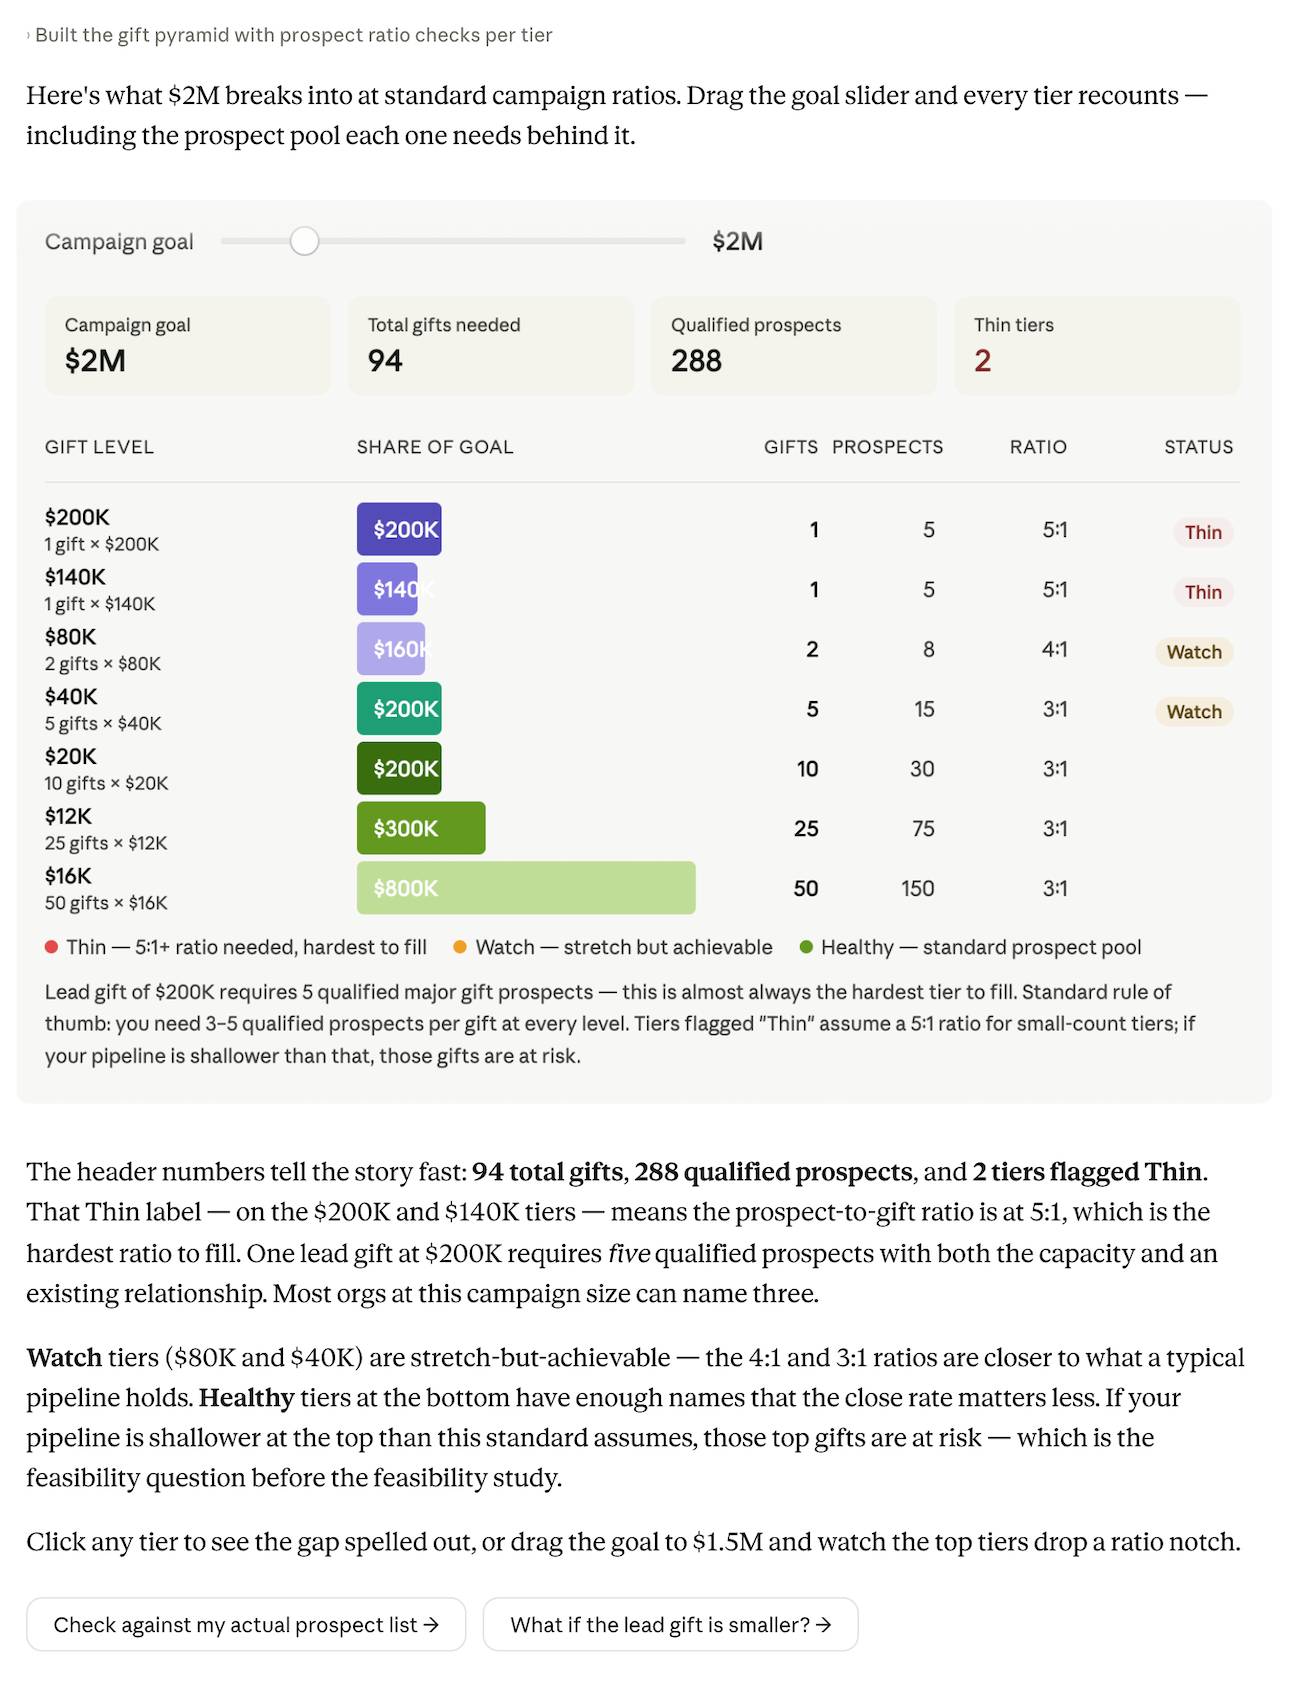
Create an interactive visual with the table visible alongside it.
Claude can generate interactive visuals, according to its custom visuals documentation. Ask explicitly for controls and a calculation table; a first response may need refinement. See also using Claude Artifacts to visualize data.
3. Add the context that makes gaps meaningful
Use aggregate counts to describe the pipeline. Define what your organization means by qualified: for example, a prospect whose capacity, connection, and potential interest have been assessed. Estimated capacity is not a commitment to give.
Assign each prospect to one working tier for this calculation so the same person is not counted several times. Keep separate counts for unidentified prospects, qualified prospects, active conversations, and confirmed commitments if those distinctions affect the decision.
If a tier needs 12 prospects under the chosen assumption and you have five, the modeled shortfall is seven. Claude should state that calculation and its assumption, not claim that seven more donors will guarantee four gifts.
4. Test constraints one at a time
Limit the largest gift
Remove the $500,000 tier and cap each gift at $250,000.
As one illustrative alternative, replace the single $500,000 gift with two additional $250,000 gifts.
Keep all other tiers unchanged.
Recalculate gift counts and prospect requirements, retaining the assumed 3:1 ratio.
Explain where the additional prospect requirement appears.
This alternative needs four gifts at $250,000 and 12 prospects at that tier under the assumption. It reaches the same financial goal, but it changes which relationships the campaign would need.
Change the conversion assumption
Compare 2:1, 3:1, and 4:1 prospect-to-gift assumptions using the same gift table.
Do not change gift amounts or counts.
Show the requirement and known gap for each tier under each assumption.
Varying this input shows how sensitive the plan is to conversion. It does not establish which ratio will occur.
Assess an 18-month schedule
Create an 18-month planning timeline using the pipeline stages and dates I provide.
If timing information is missing, mark it unknown and ask for it.
Separate a donor's commitment date from expected payment dates.
Do not invent standard cultivation durations or assume every prospect advances.
5. Keep the controls and conclusions honest
A goal slider needs an allocation rule. Specify whether changing the goal changes gift sizes, whole-number gift counts, or selected tiers. Ask Claude to show any surplus or shortfall caused by rounding, rather than silently displaying a pyramid that misses the target.
Before presenting the result, verify totals, integer gift counts, ratios, and actual-prospect inputs. Distinguish a mathematical path to the target from evidence that the campaign is feasible.
Keep a checked table with your chart. The overview of Claude's interactive visuals explains the distinction between conversational visuals and standalone artifacts; use the format that works for your meeting and available export options.
Related Articles
 Tips for Using Project in Claude Effectively to Create a Personal AI Space8 minutes read
 Should I Buy ChatGPT Plus or Claude Pro?10 minutes read
 How to use the /goal command in Claude Code for fully11 minutes read
 What Is the Claude Code: Clear Explanation7 minutes read
 Claude API: How to Get the Key and Use the API: Explained19 minutes read
 What Is Claude AI: Clear Explanation9 minutes read
Reader Comments 0
Sign in with email or Google to join the discussion.